GrapHNR-2023-supplementary-material
GrapHNR 2023 - Supplementary Material
Overview
Use Cases
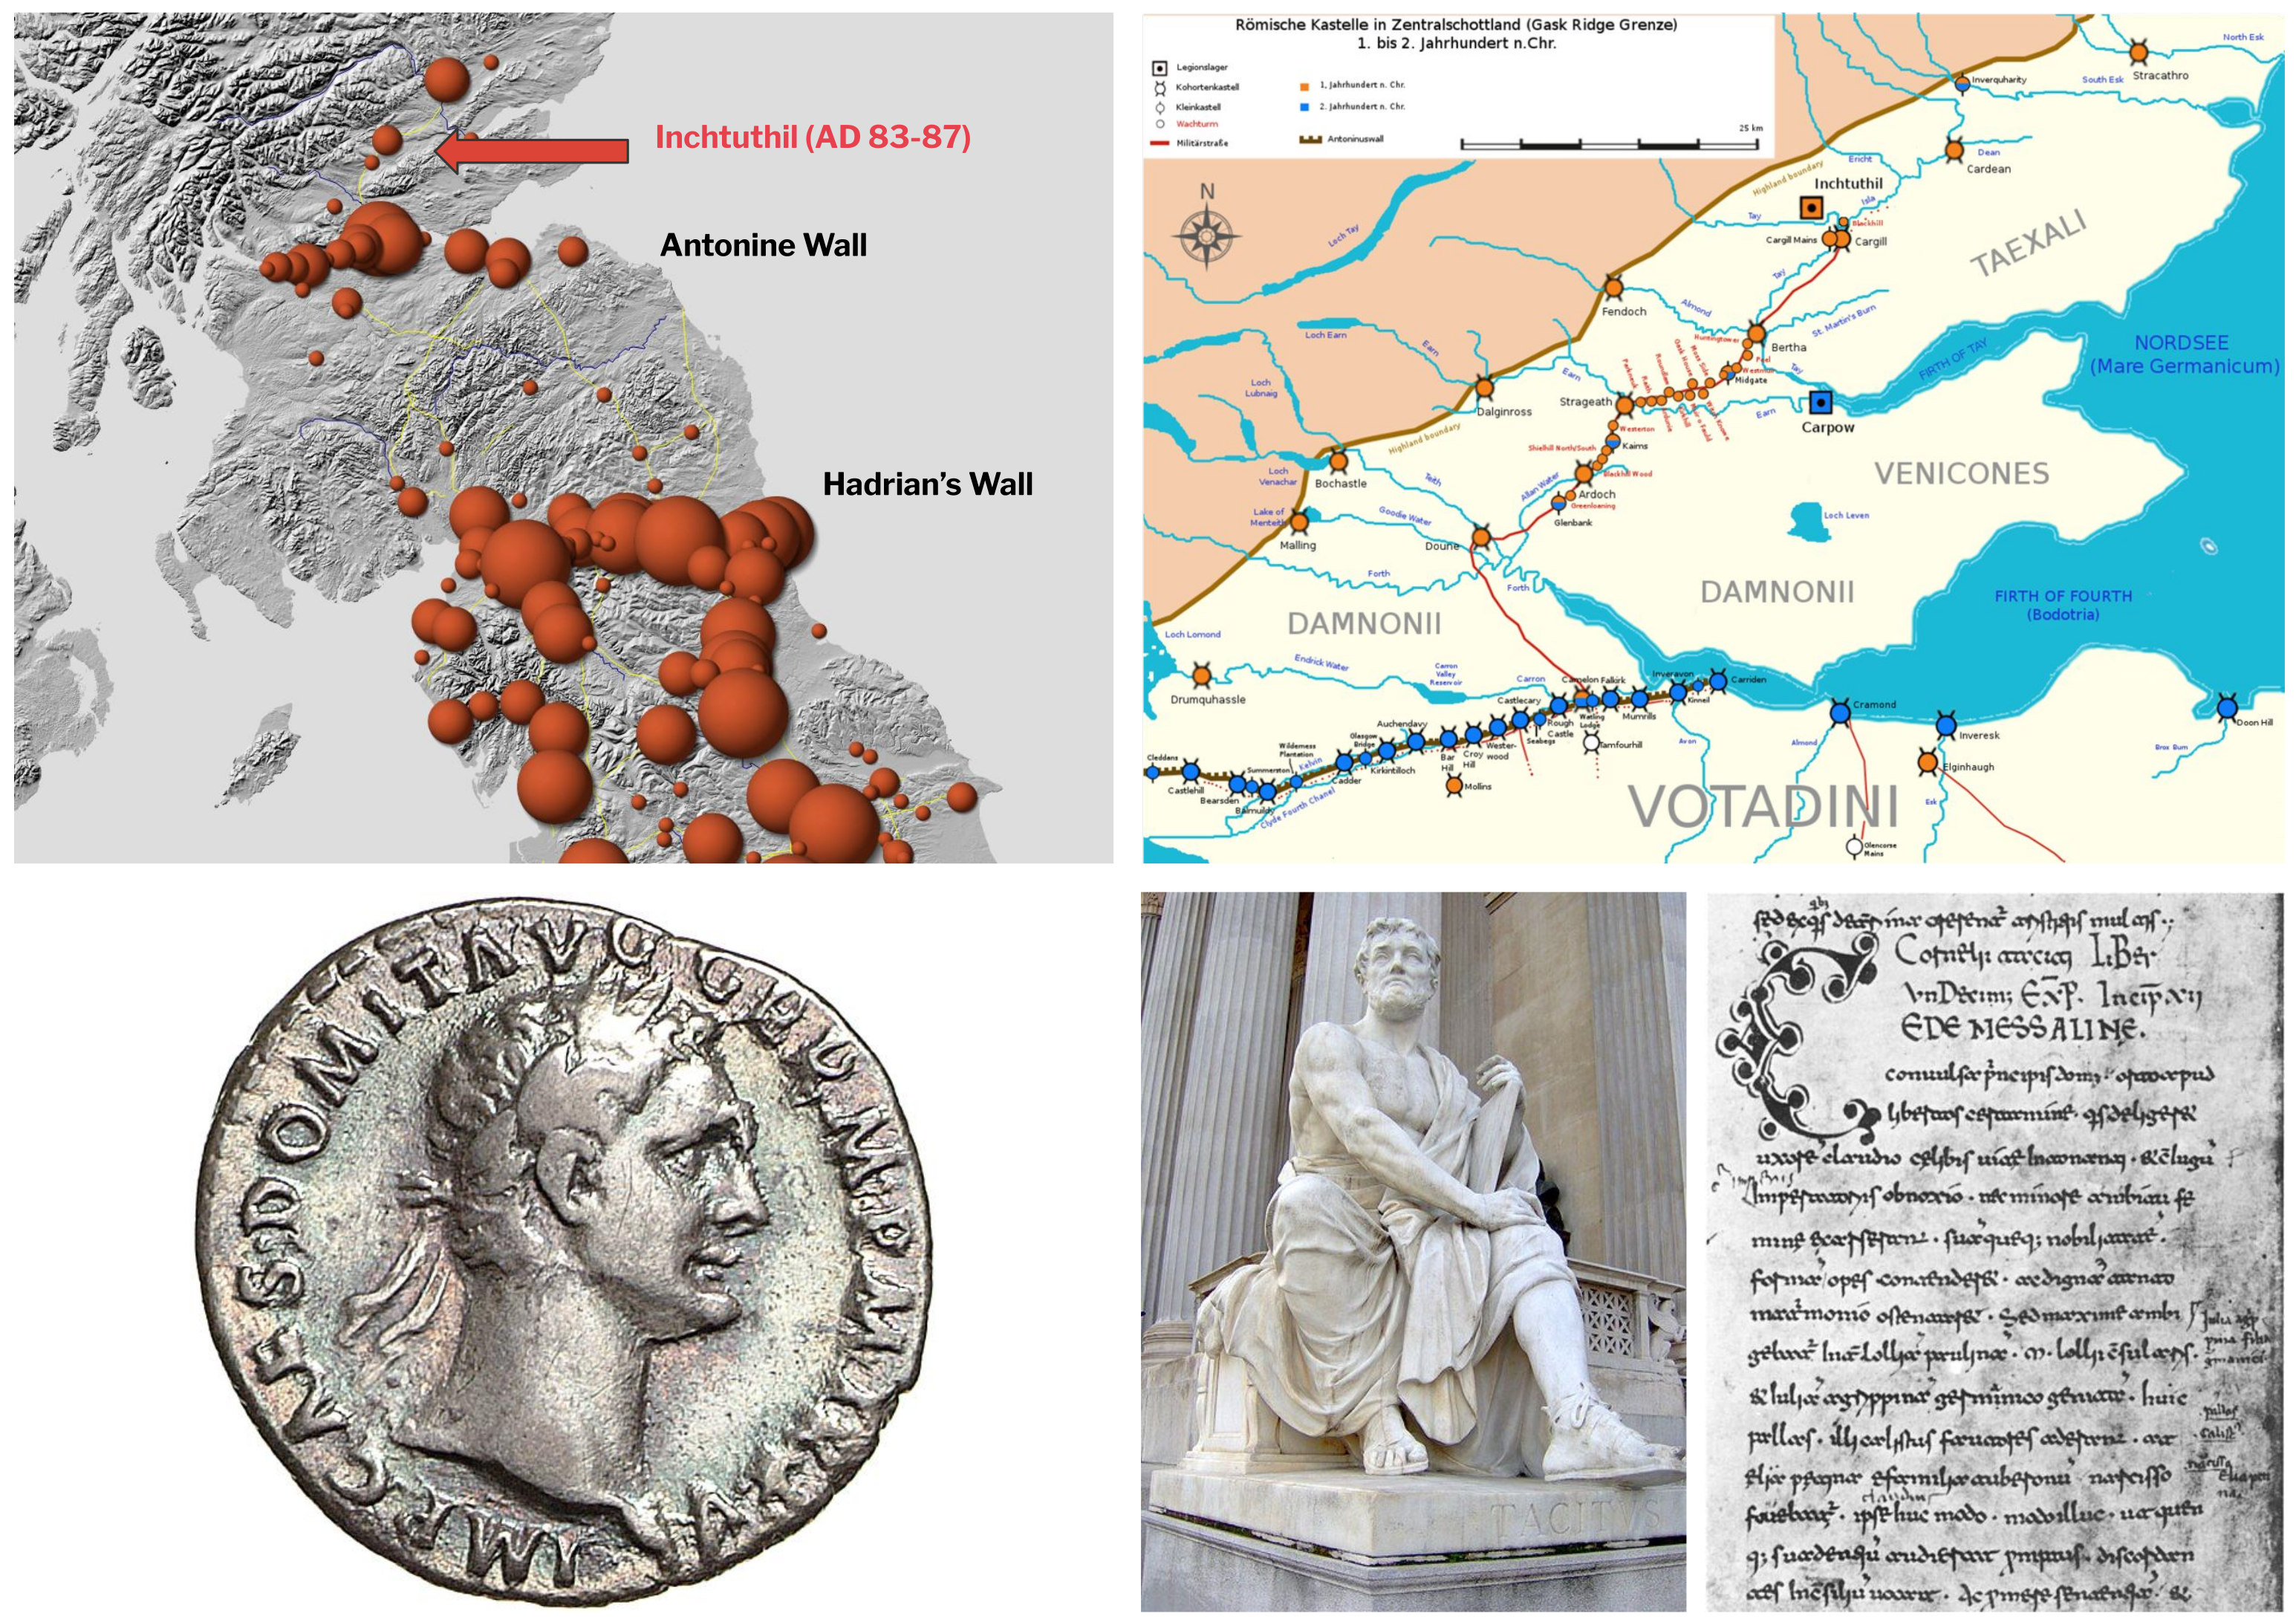
Top-Left: Findspots of Samian Ware in Samian Research. Graphic: LEIZA / Samian Research, CC BY 4.0. Top-Right: Roman forts in central Scotland (Gask Ridge), first to second century AD. Graphic: Veleius, CC BY 3.0, via Wikimedia Commons. Bottom-Left: Domitianus, AD 86, IMP CAES DOMIT AVG GERM P M TR P V. Head of Domitianus with laurel wreath to the right. Photo: Münzkabinett der Staatlichen Museen, photo by Dirk Sonnenwald, PDM 1.0 DEED, via https://ikmk.smb.museum/object?id=18232046. Bottom-Center: Vienna parliament, Tacitus statue. Photo: Pe-Jo, Public domain, via Wikimedia Commons. Bottom-Right: Part of a page of the Codex Laurentianus Mediceus Plut. 68.2, containing the explicit of book XI and the incipit of book XII of Tacitus’ Annales. Photo: Tacitus, Public domain, via Wikimedia Commons
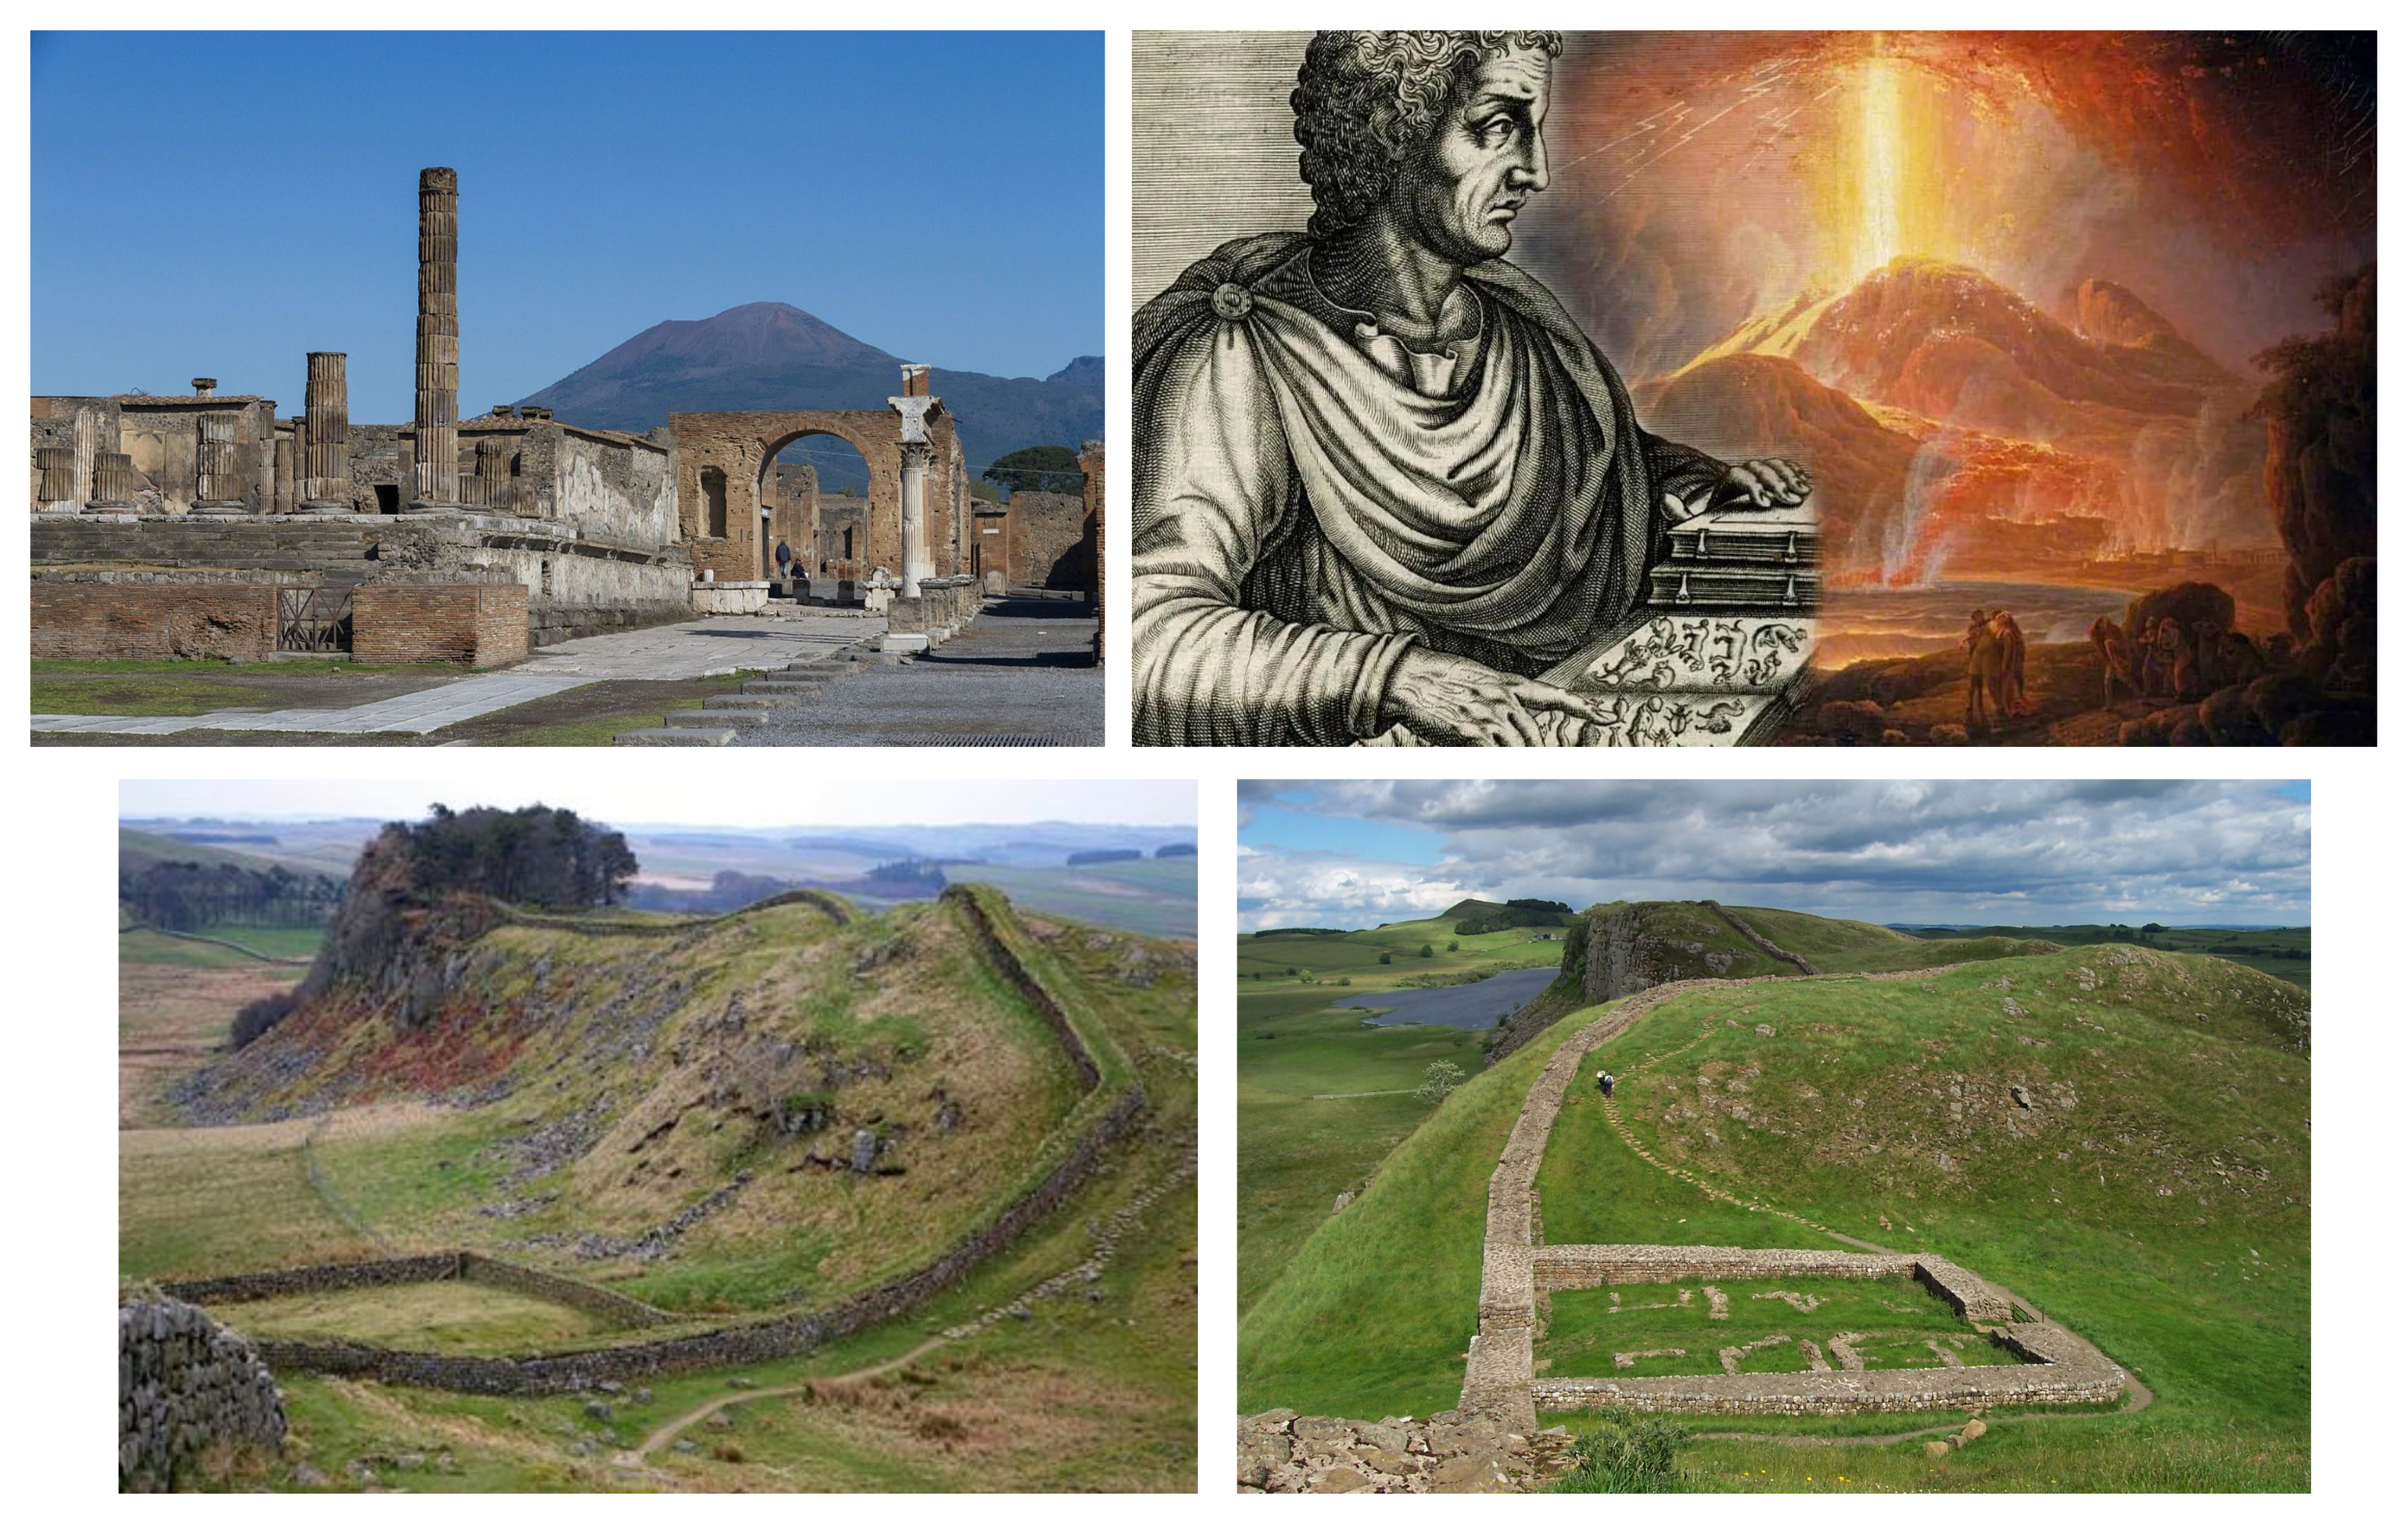
Top-Left: Pompeji Forum. Photo: Matthias Süßen, CC BY-SA 3.0, via Wikimedia Commons. Top-Right-Left: Portrait of Pliny the Elder, half-length in profile to right, studying at table on which are books and plants; illustration to Thevet’s “Vrais portraits et vies des hommes illustres (Paris, 1584), p. 612. Engraving and letterpress. Photo: The Trustees of the British Museum, CC BY-NC-SA 4.0, via British Museum. Top-Right-Right: Mount Vesuvius in Eruption, Oil on canvas, Jacob More (1780). Photo: National Galleries of Scotland, photographed by Antonia Reeve, CC BY-NC, via nationalgalleries.org. Bottom-Left: Hadrian’s wall at Cuddy’s Crags and Housesteads Crags. Photo: Phil Champion, CC BY-SA 2.0, via Wikimedia Commons. Bottom-Right: The remains of Milecastle 39 (coordinates 55° 0’ 13.12” N, 2° 22’ 32.74” W) on Hadrian’s Wall; near Steel Rigg, looking east from a ridge along the Hadrian’s Wall Path. Milecastle 39 is also known as Castle Nick. Photo: Adam Cuerden, Public domain, via Wikimedia Commons
FAIR and LOD
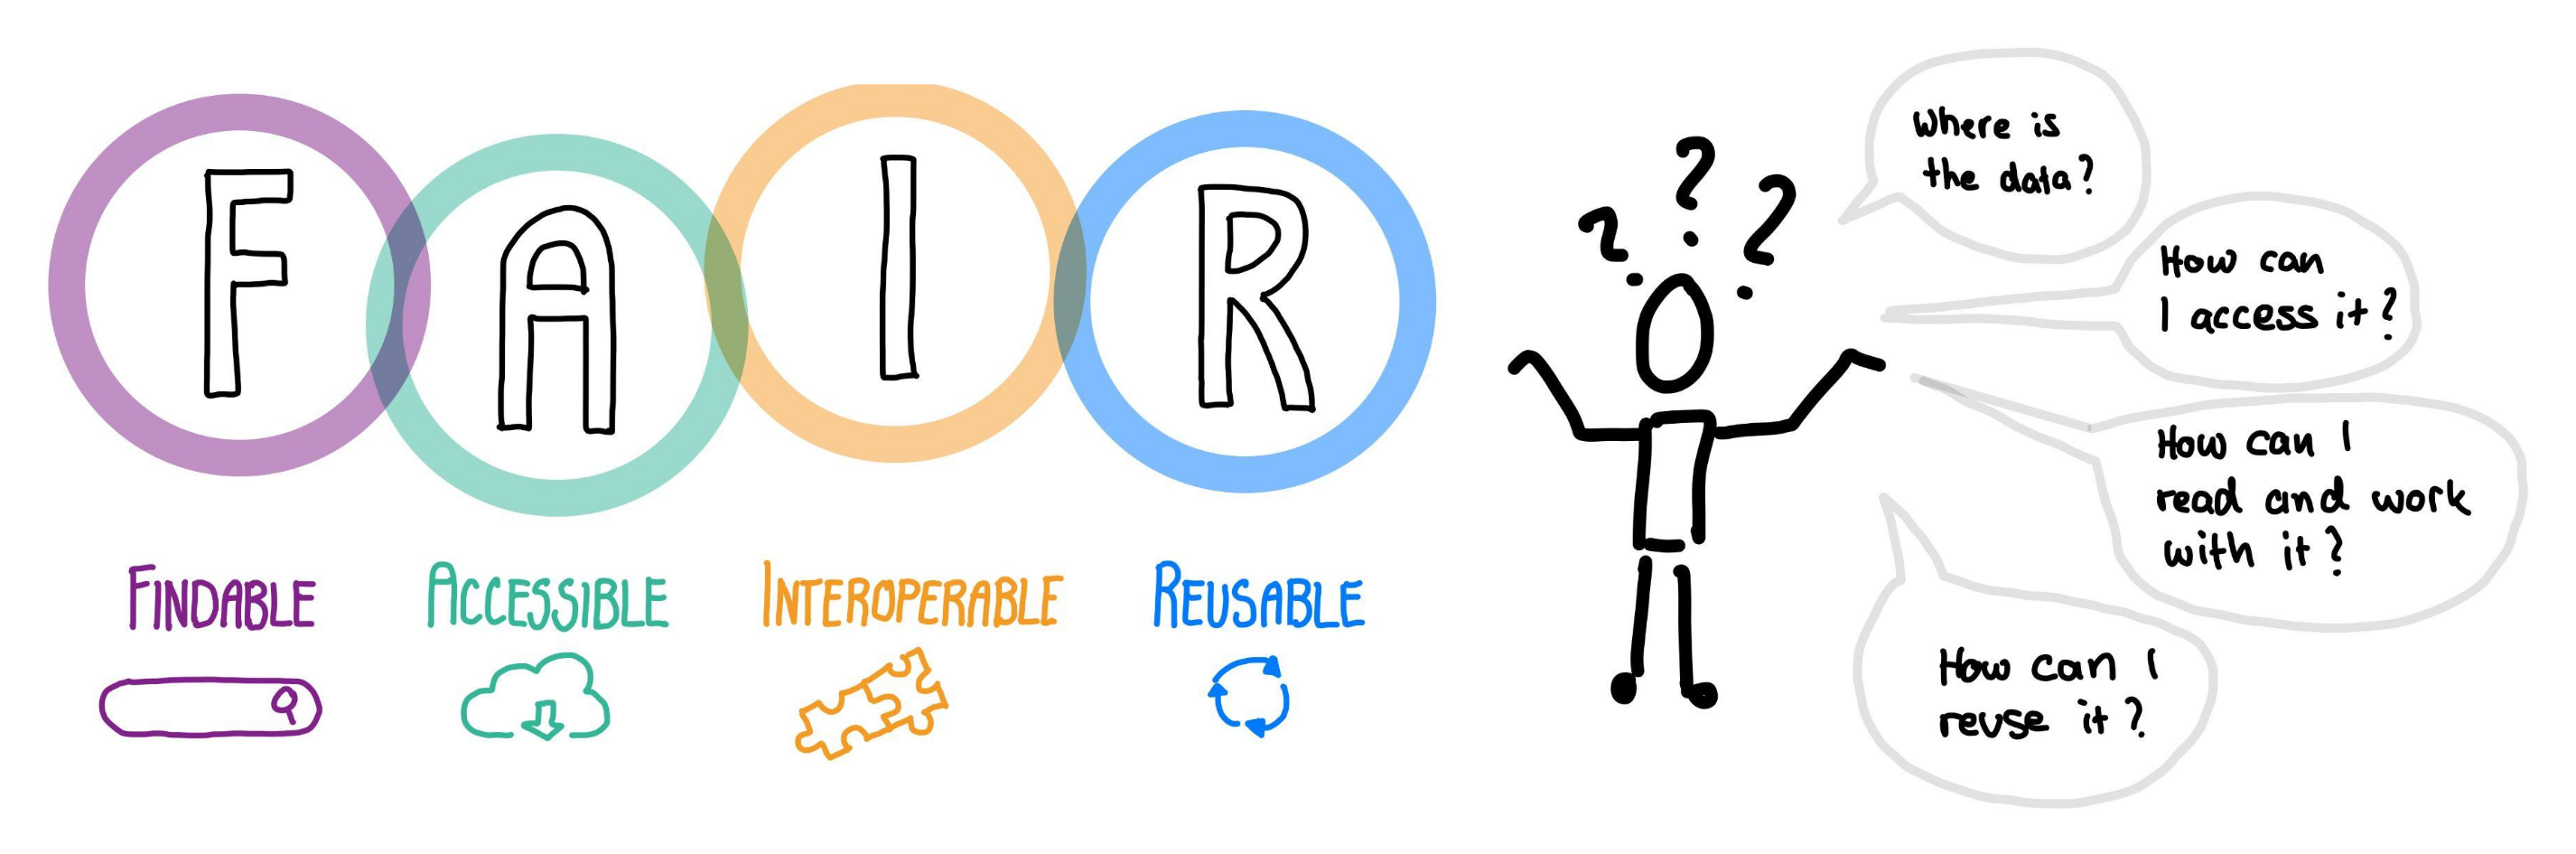
The FAIR data principles and its questions. Graphics: Dr. Heidi Seibold, CC BY 4.0, via Wikimedia Commons
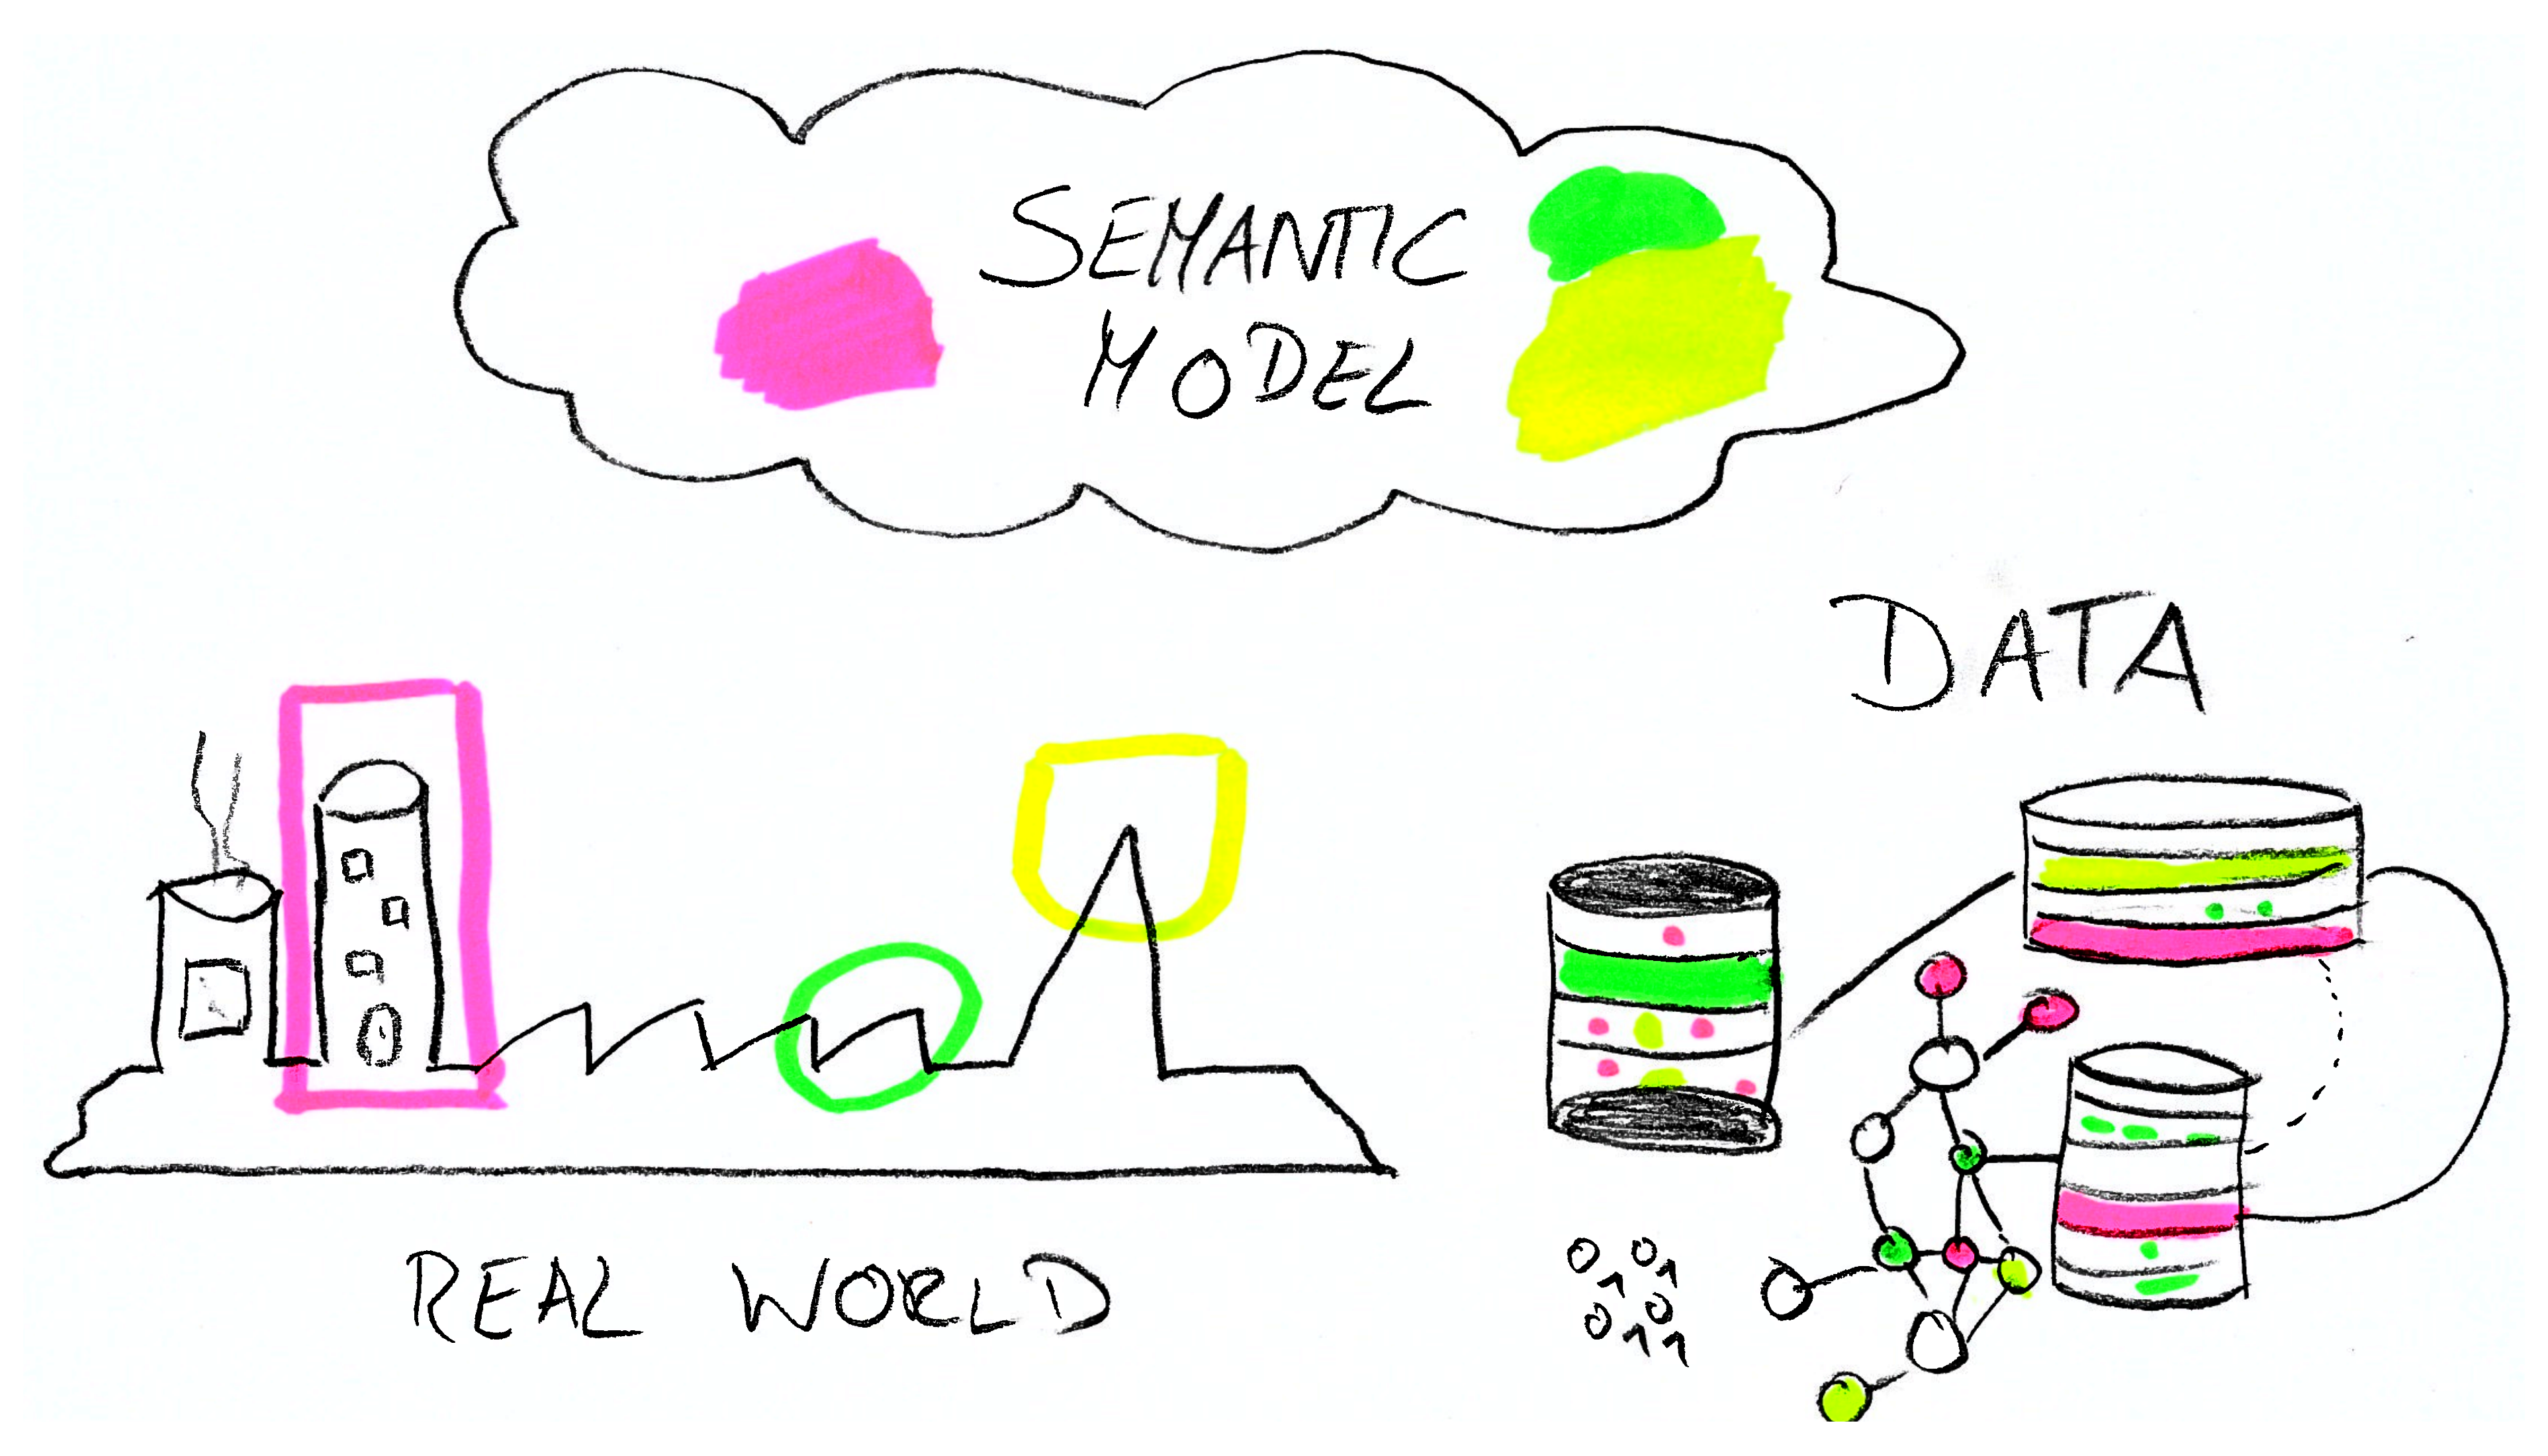
Semantic modeling from Real Life to Databases. Graphic: Florian Thiery, CC BY 4.0, via Wikimedia Commons
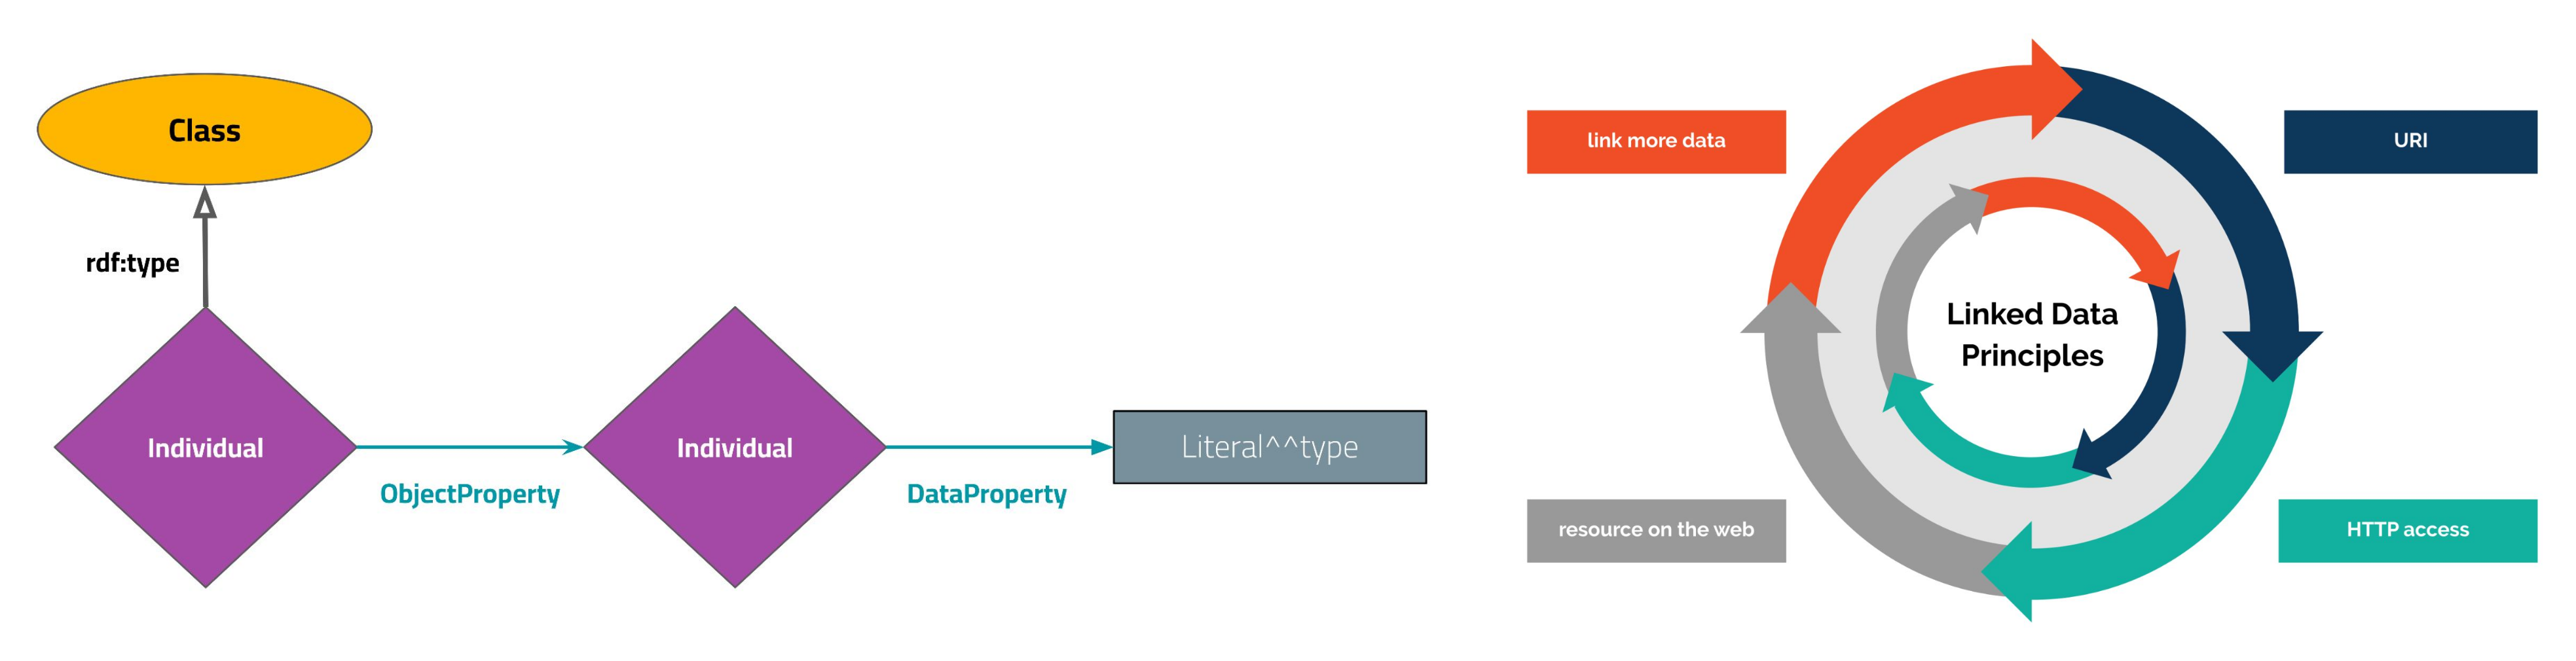 left: Ontology Scheme: Classes, Individuals, Properties and Literals; right: Linked Data Principles. Graphic: Florian Thiery, CC BY 4.0, via Wikimedia Commons
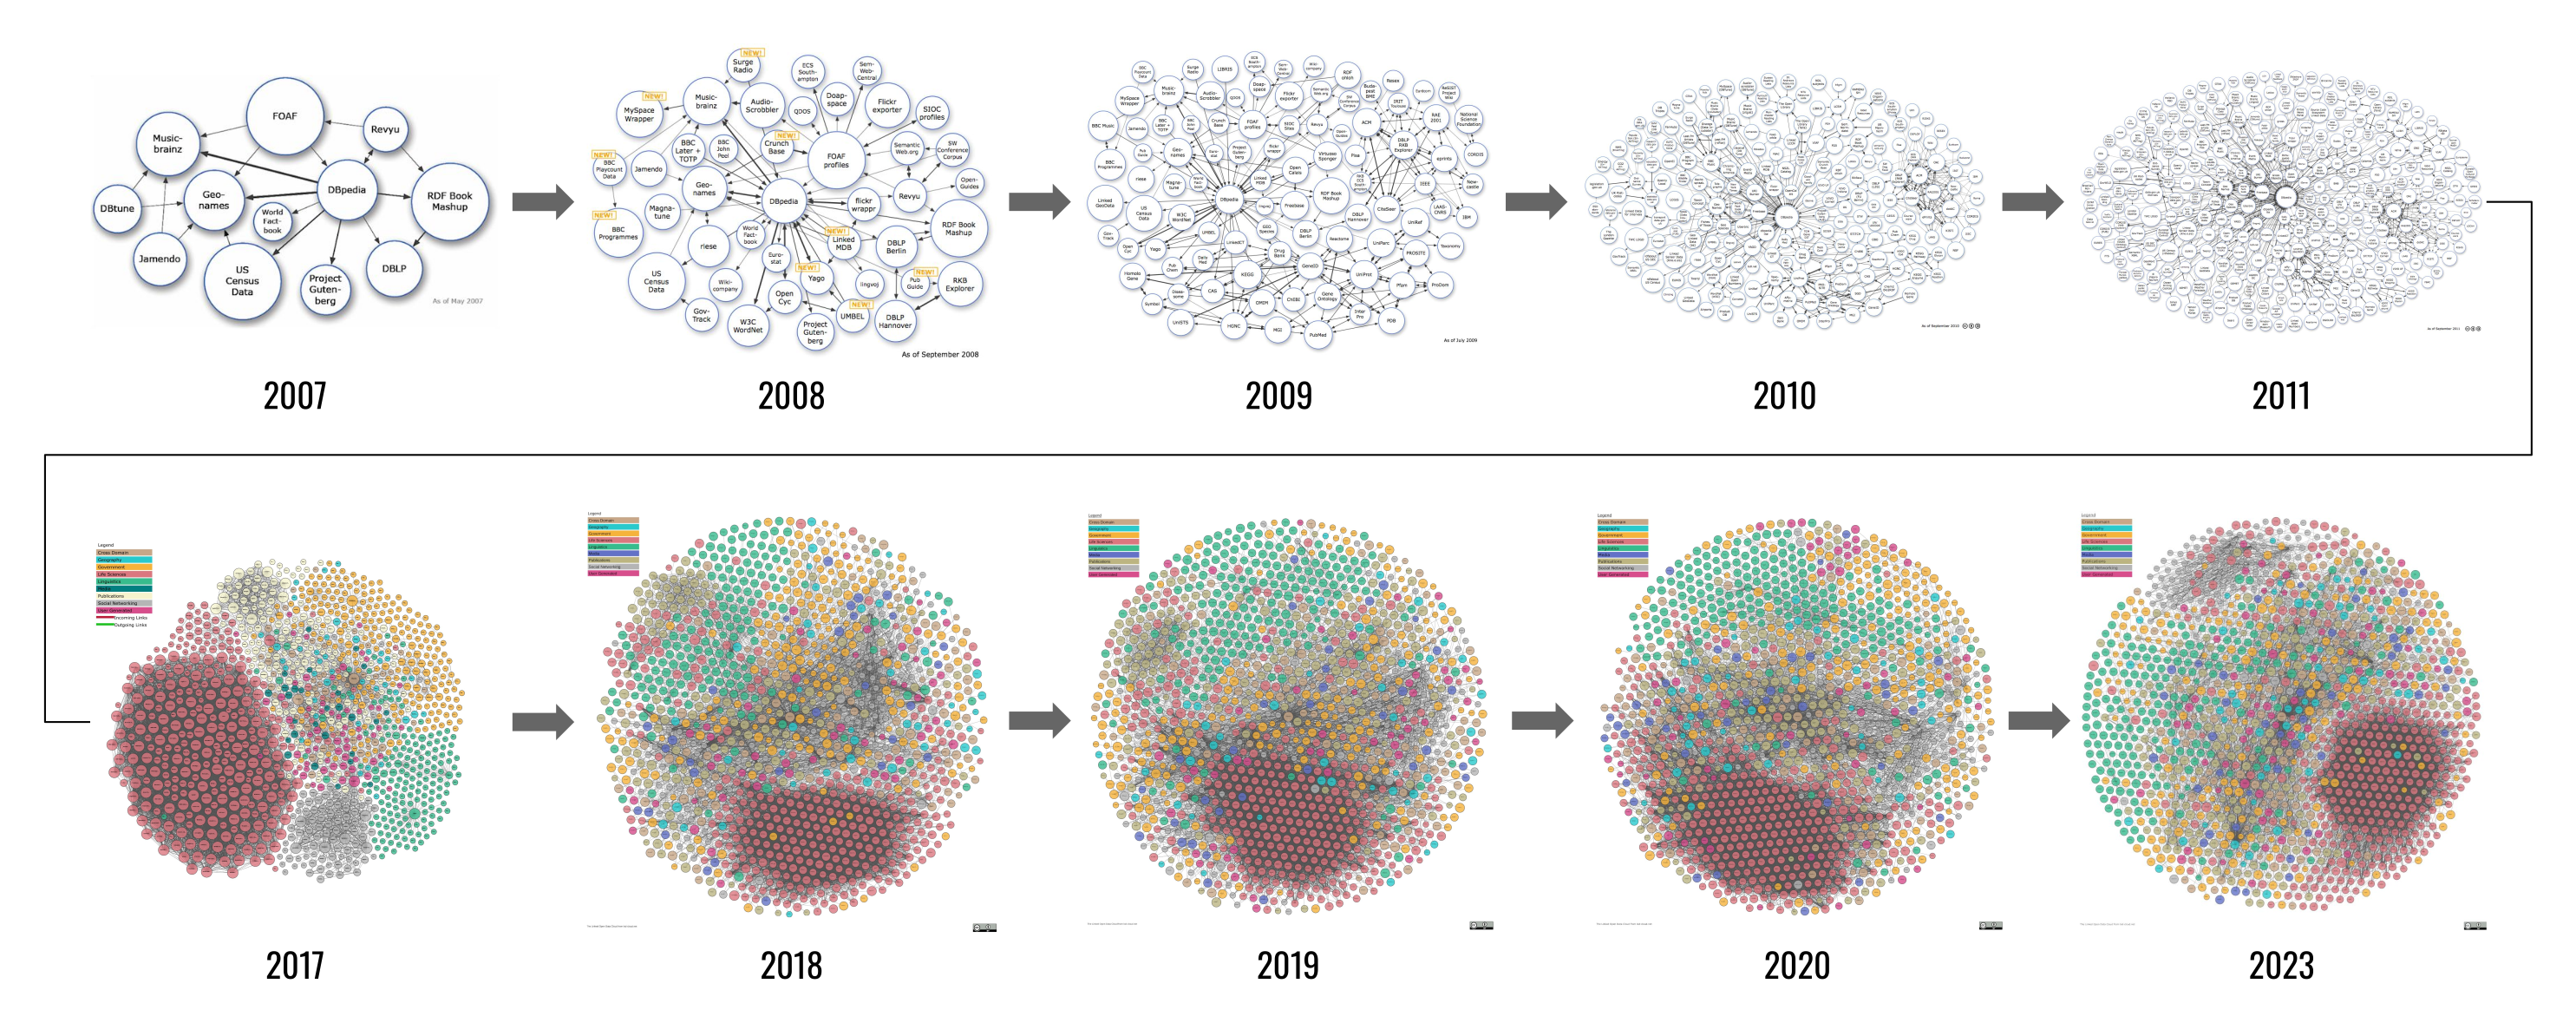
Linked Open Data Cloud images from lod-cloud.net (CC BY 4.0). Graphic: Florian Thiery based on lod-cloud.net, CC BY 4.0, via Wikimedia Commons
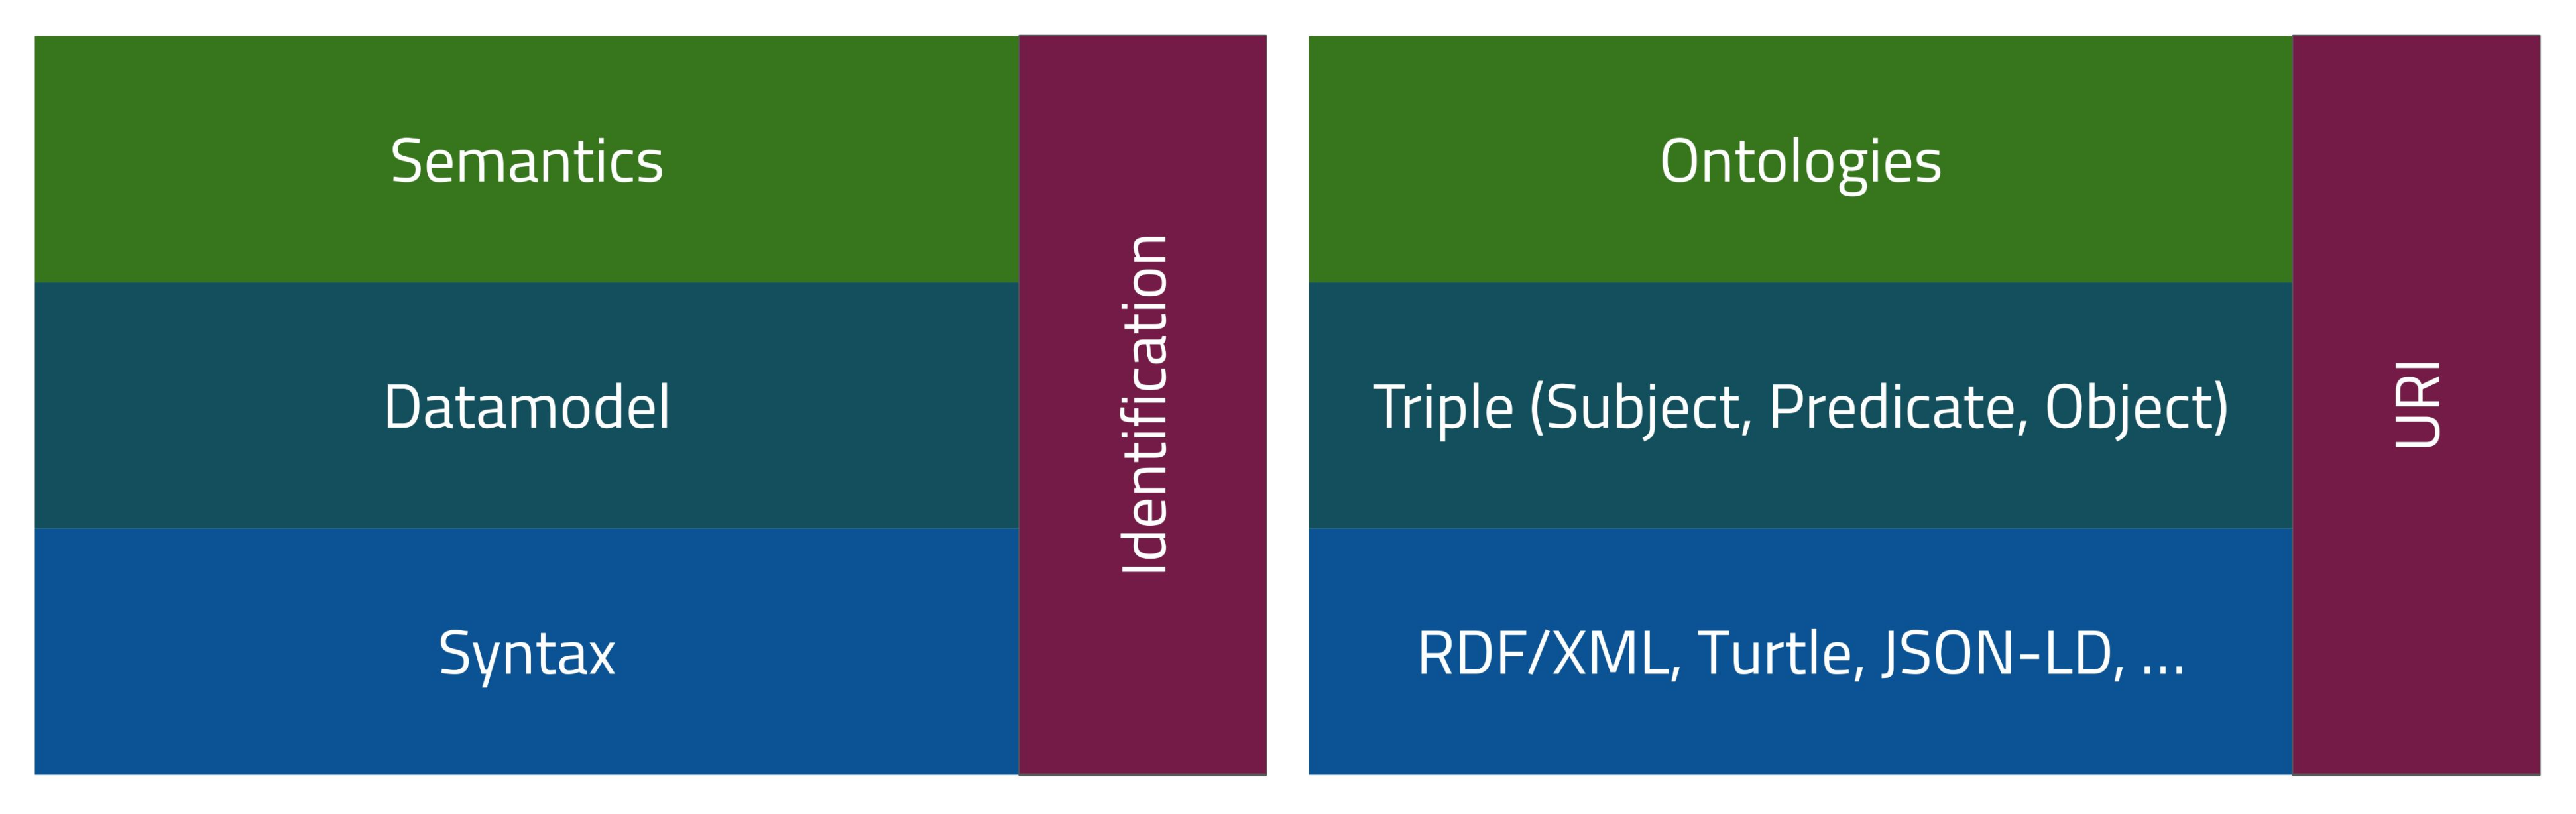
left: Generic Metadata Framework Scheme; right: RDF Metadata Framework Scheme. Graphics: Florian Thiery / RGZM, CC BY 4.0, via Wikimedia Commons
Materials and Methods
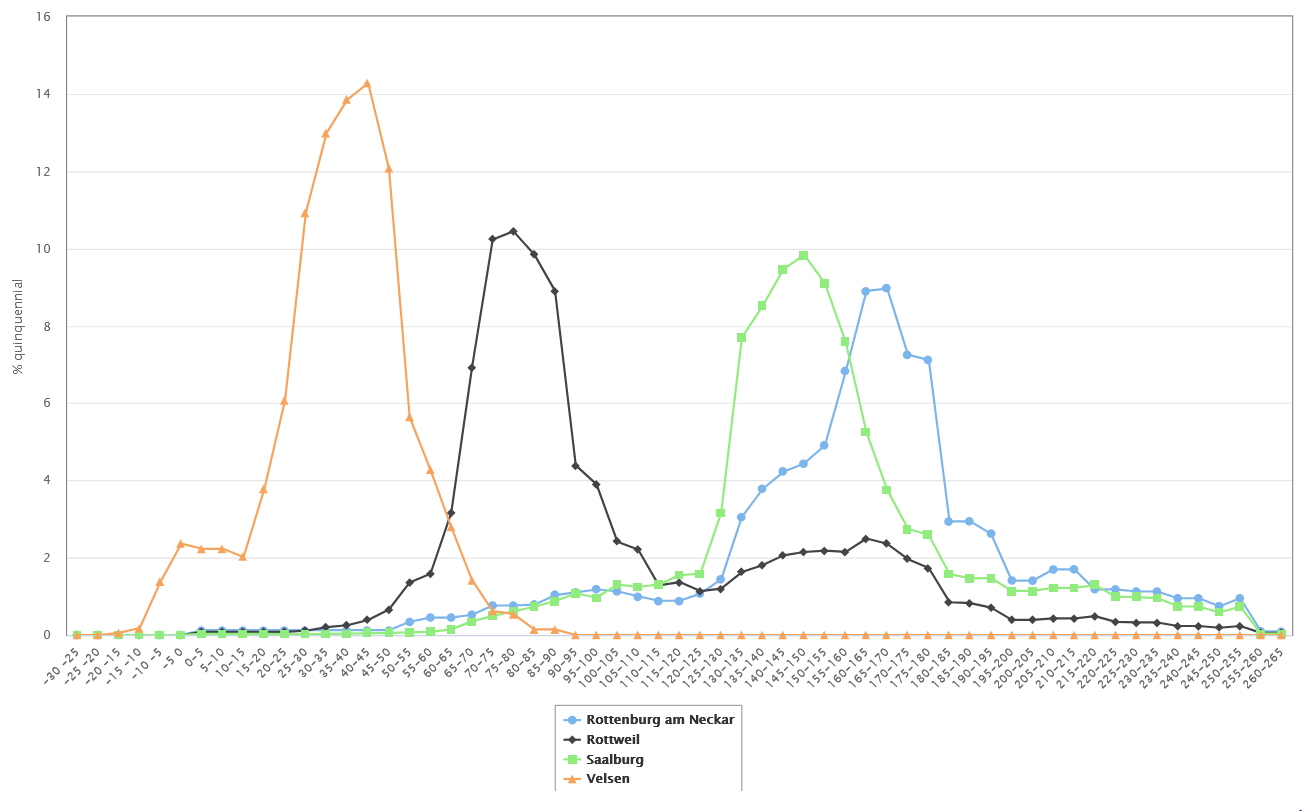
Selected dated sites with quantities per 5 years, generated at the Samian Research website. Graphic: Allard W. Mees, CC BY 4.0
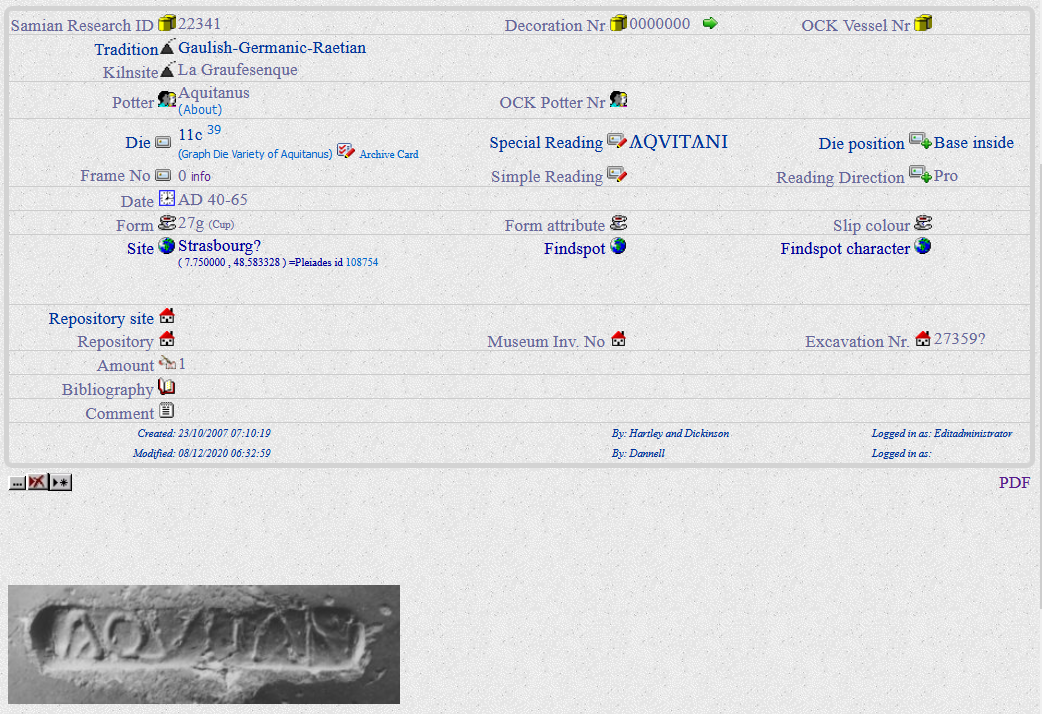
Samian Research datasheet of a stamp of the potter Aquitanus with from - to legacy dating information. Graphic: Allard W. Mees, CC BY 4.0
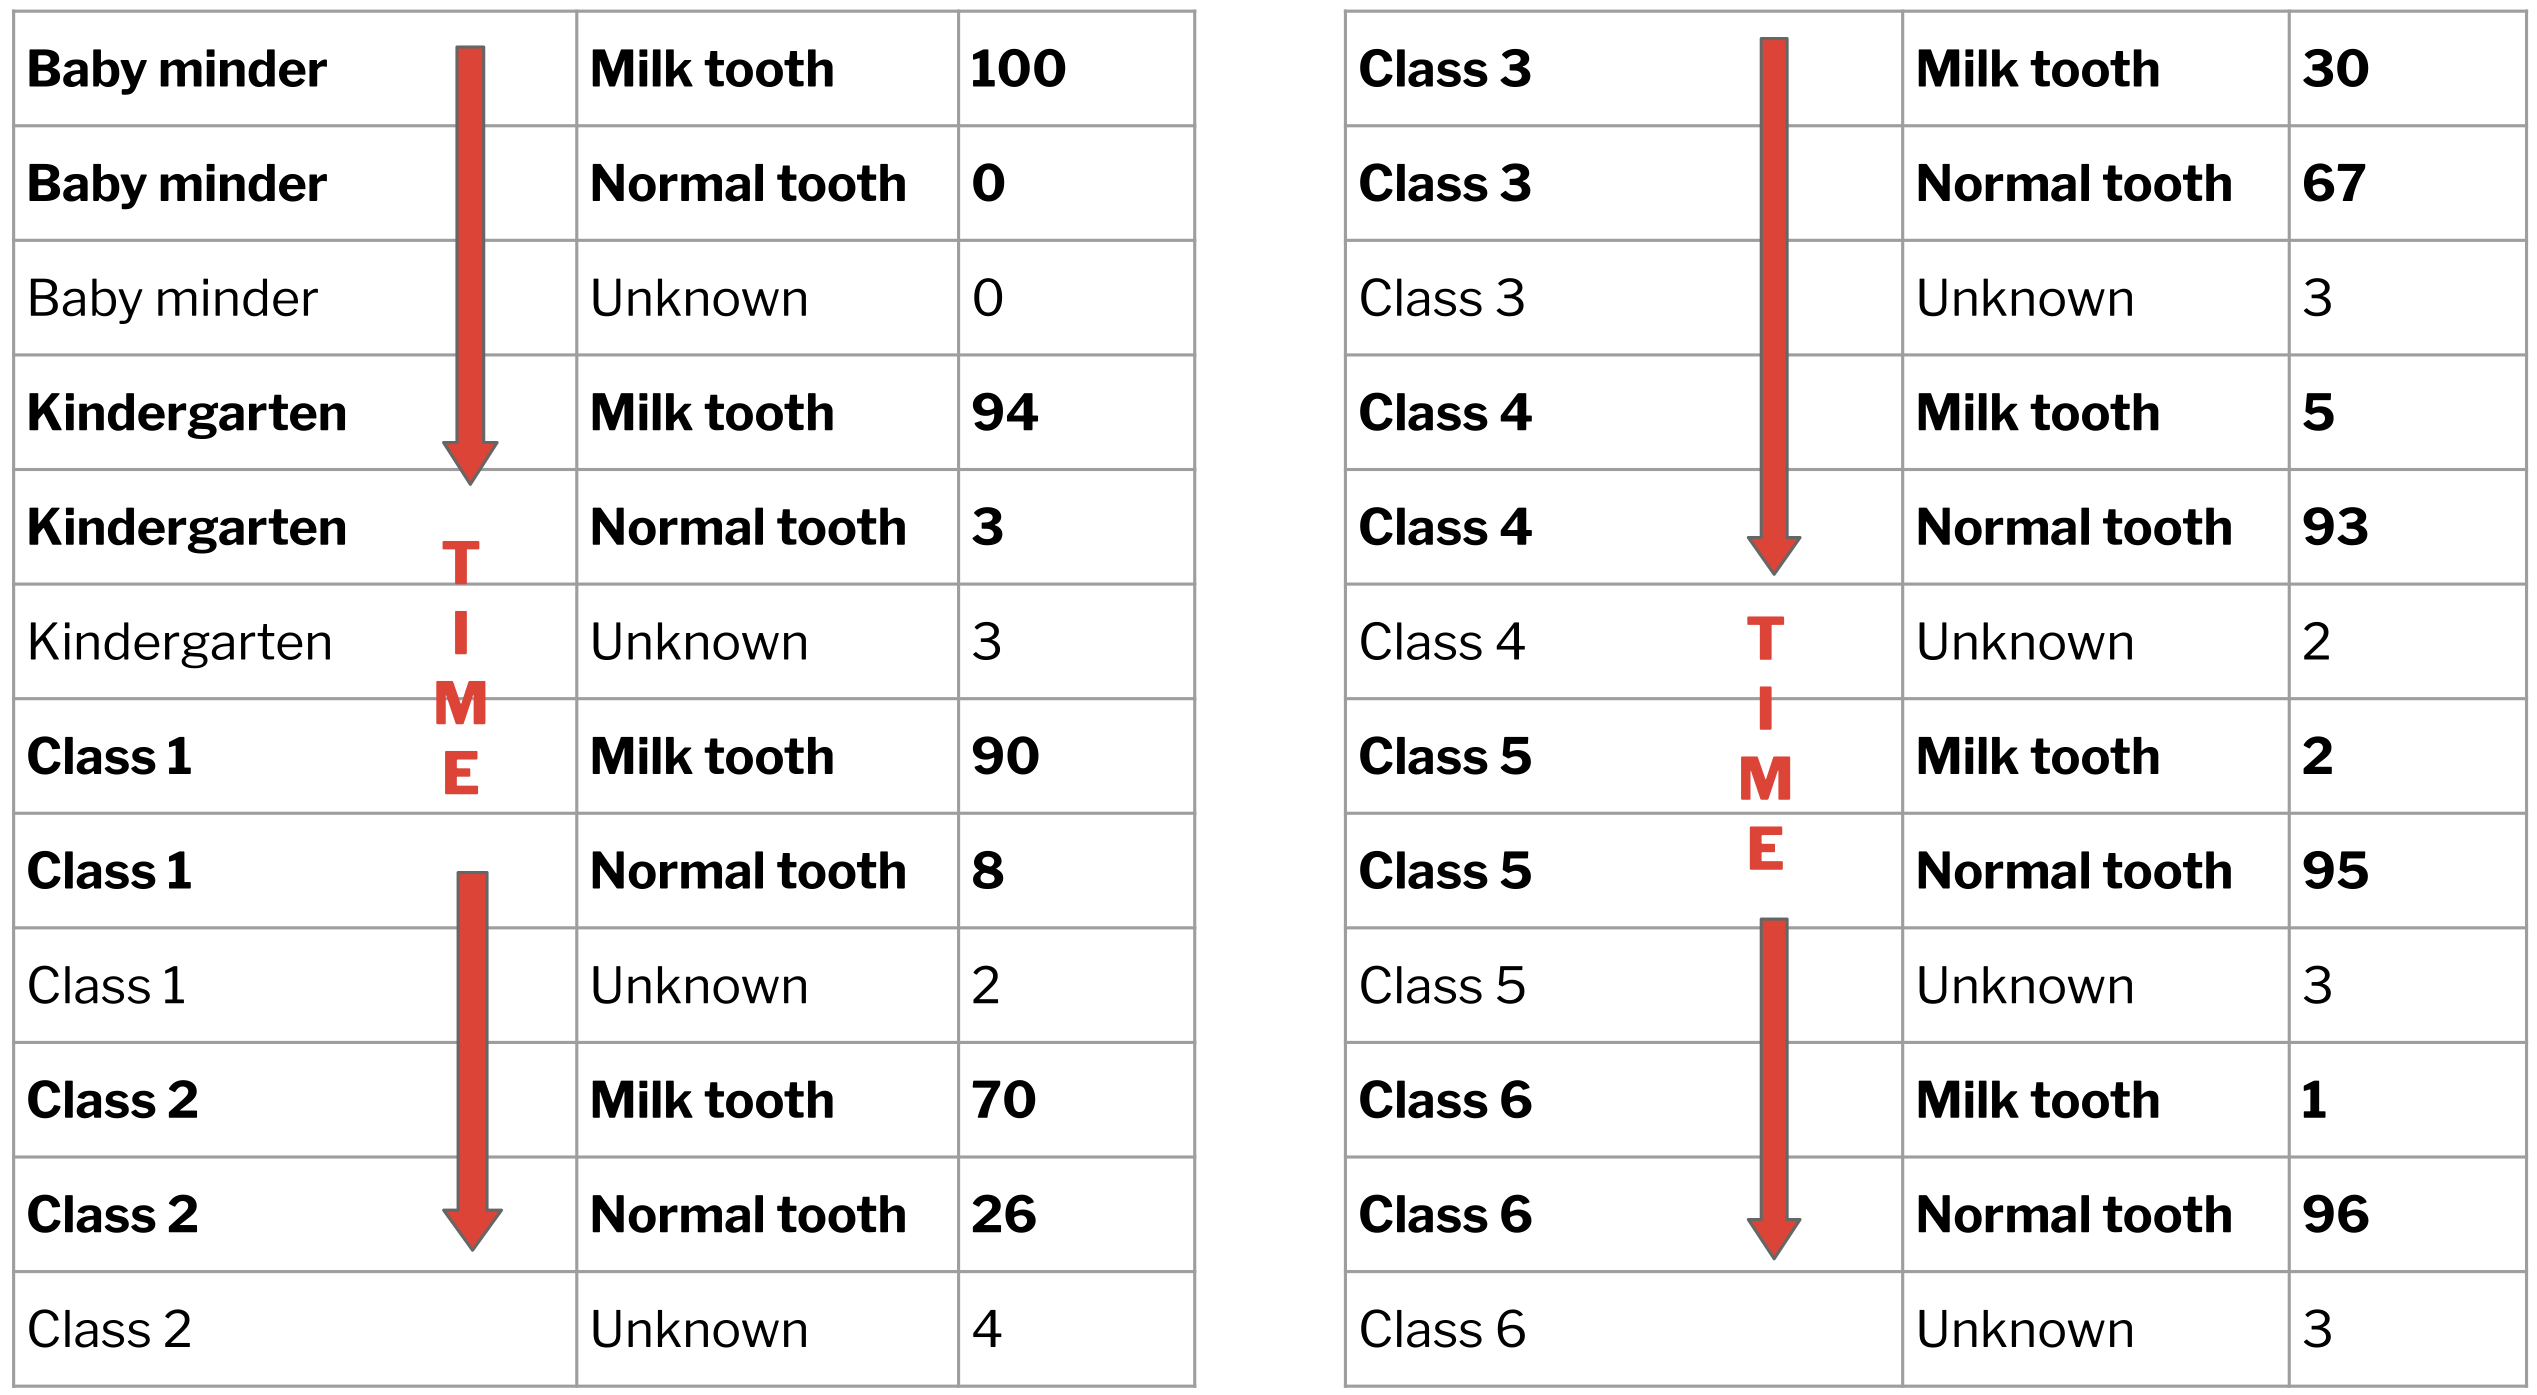
Temporal development of Milk/Normal teeth. Graphic: Allard W. Mees, CC BY 4.0
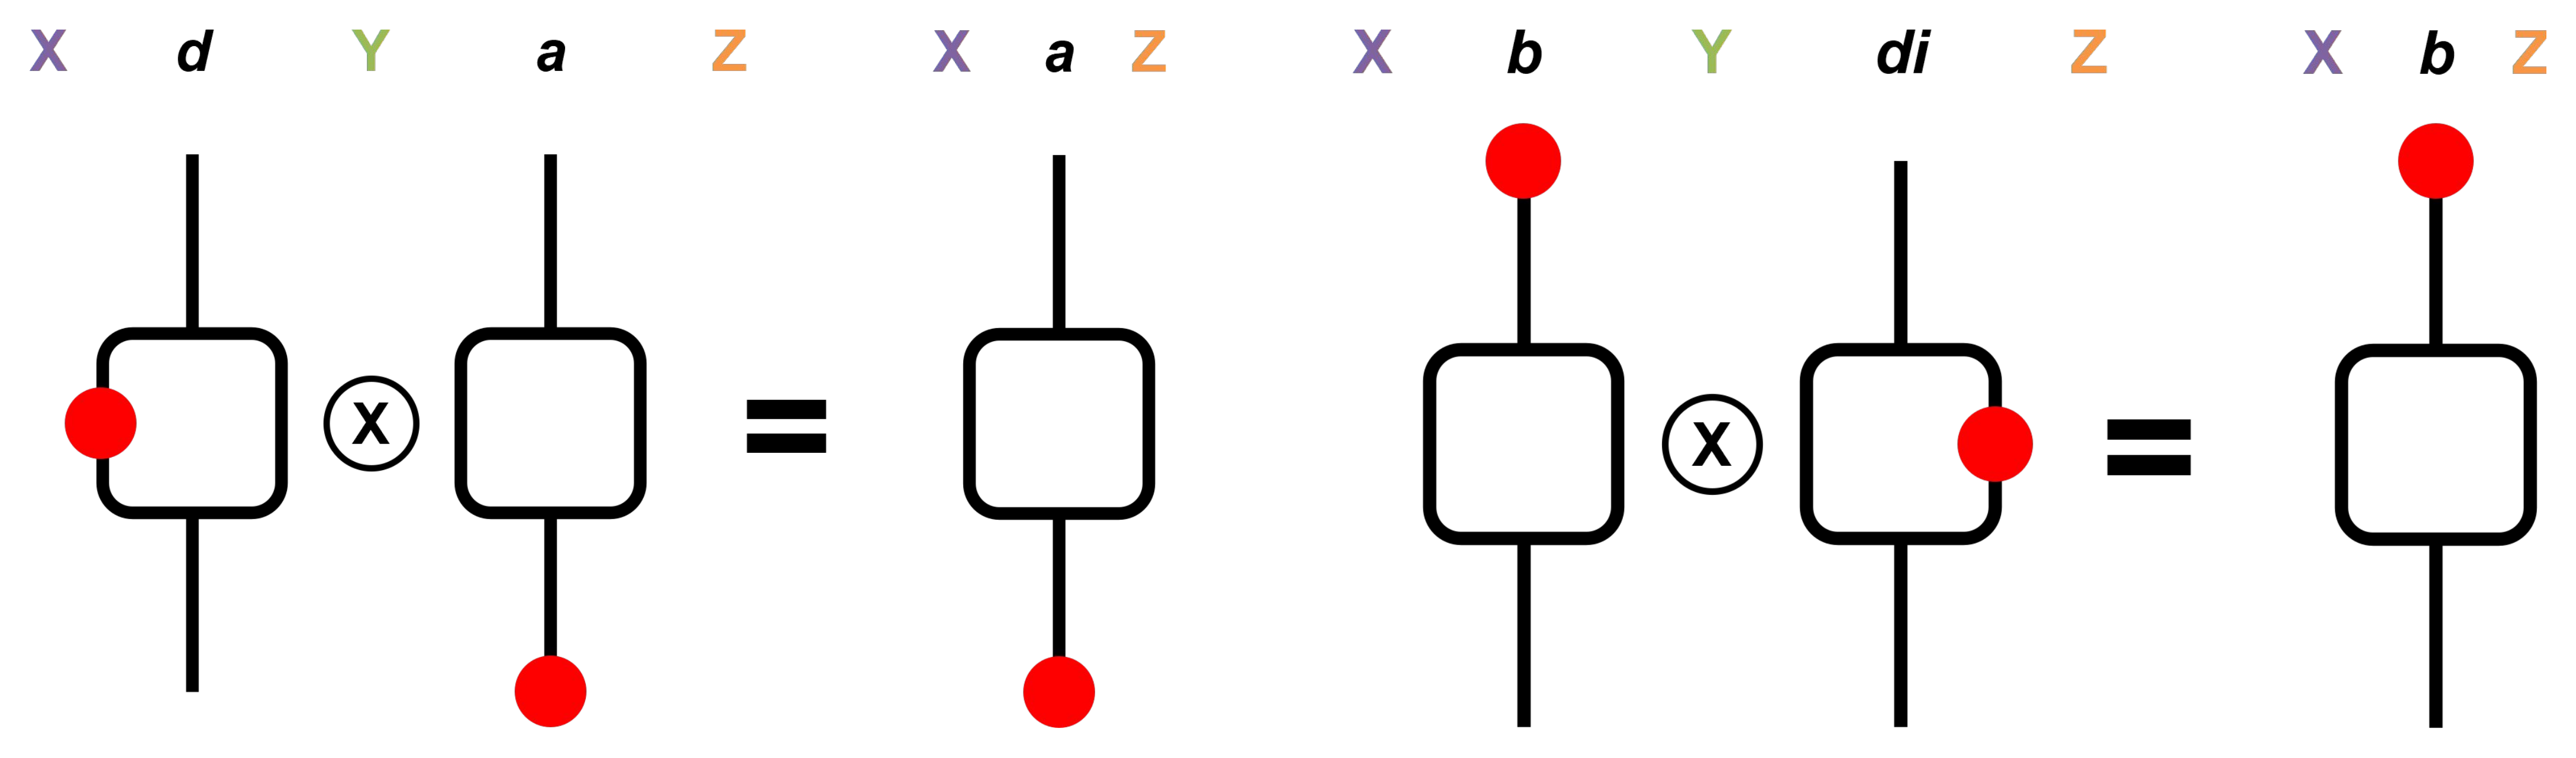
Examples of temporal reasoning based on Allen’s interval algebra. Graphic: Florian Thiery, CC BY 4.0
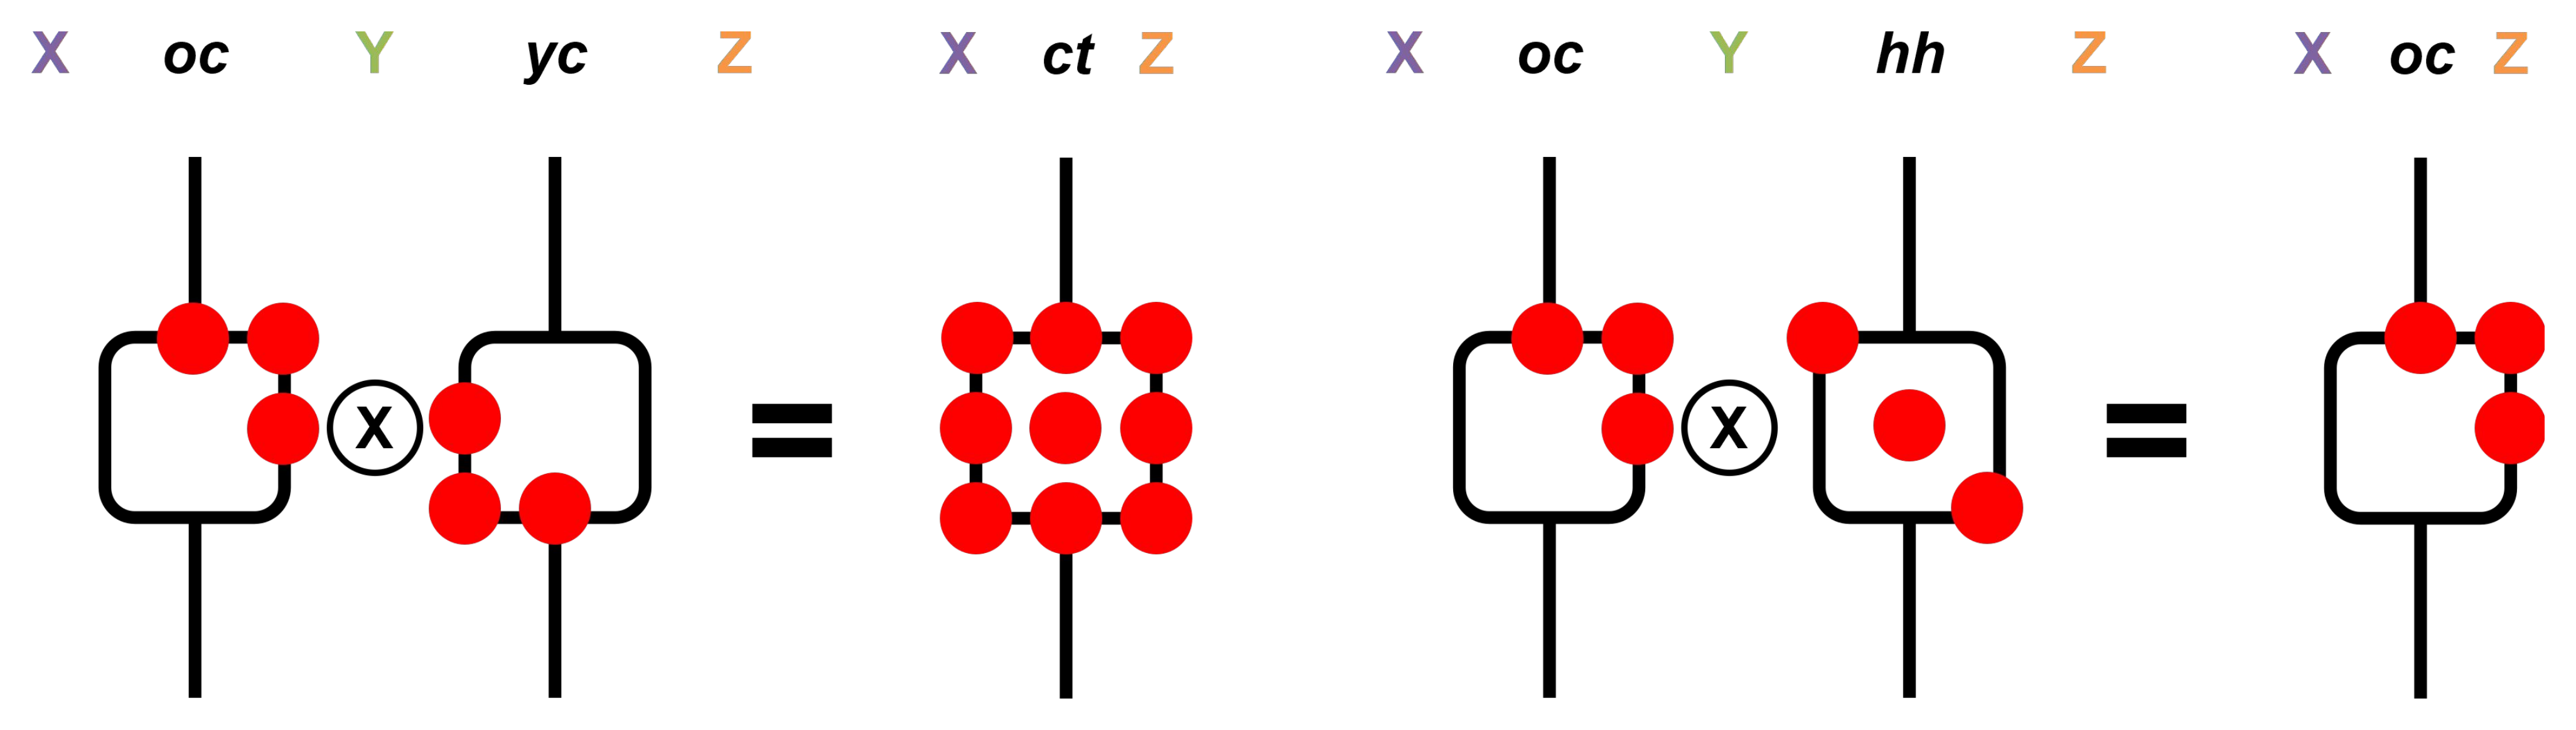
Examples for temporal reasoning based on Freksa’s semi-intervals, cf. Freksa (1992), S.25, Fig 10. Graphic: Florian Thiery, CC BY 4.0
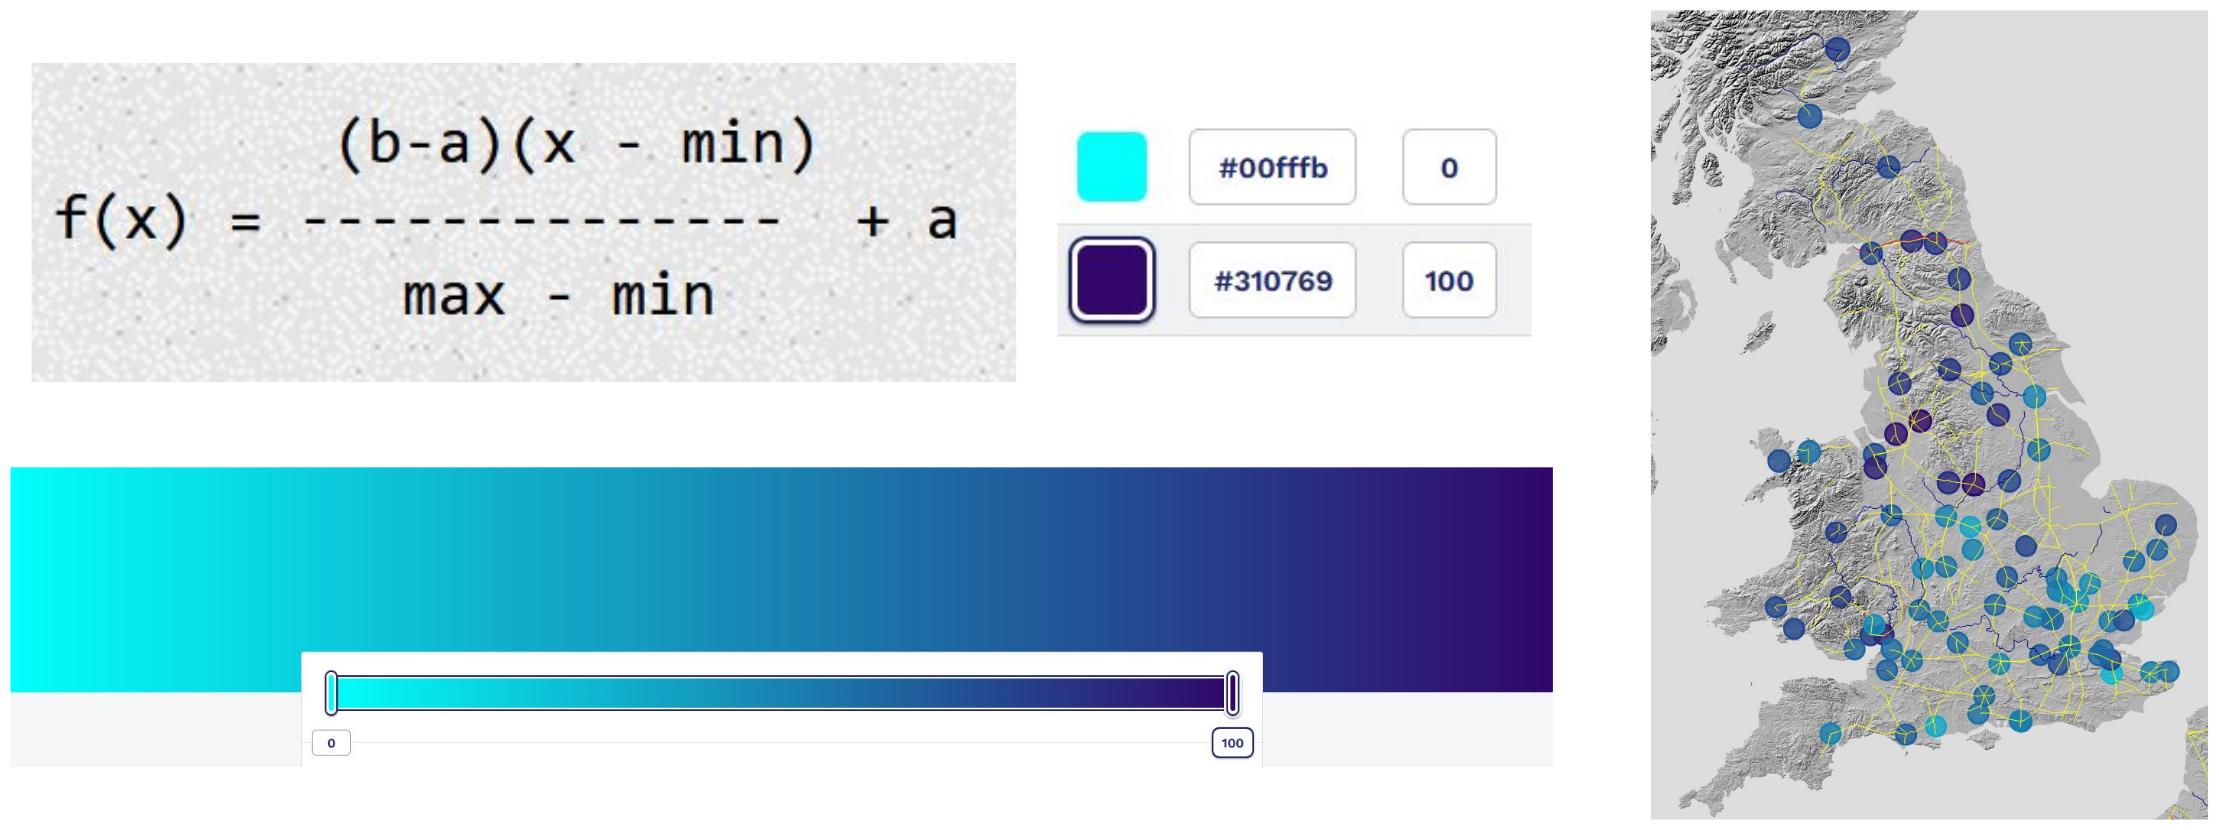
The TiGeR method (schematic representation). Graphic: Florian Thiery / Allard Mees, CC BY 4.0
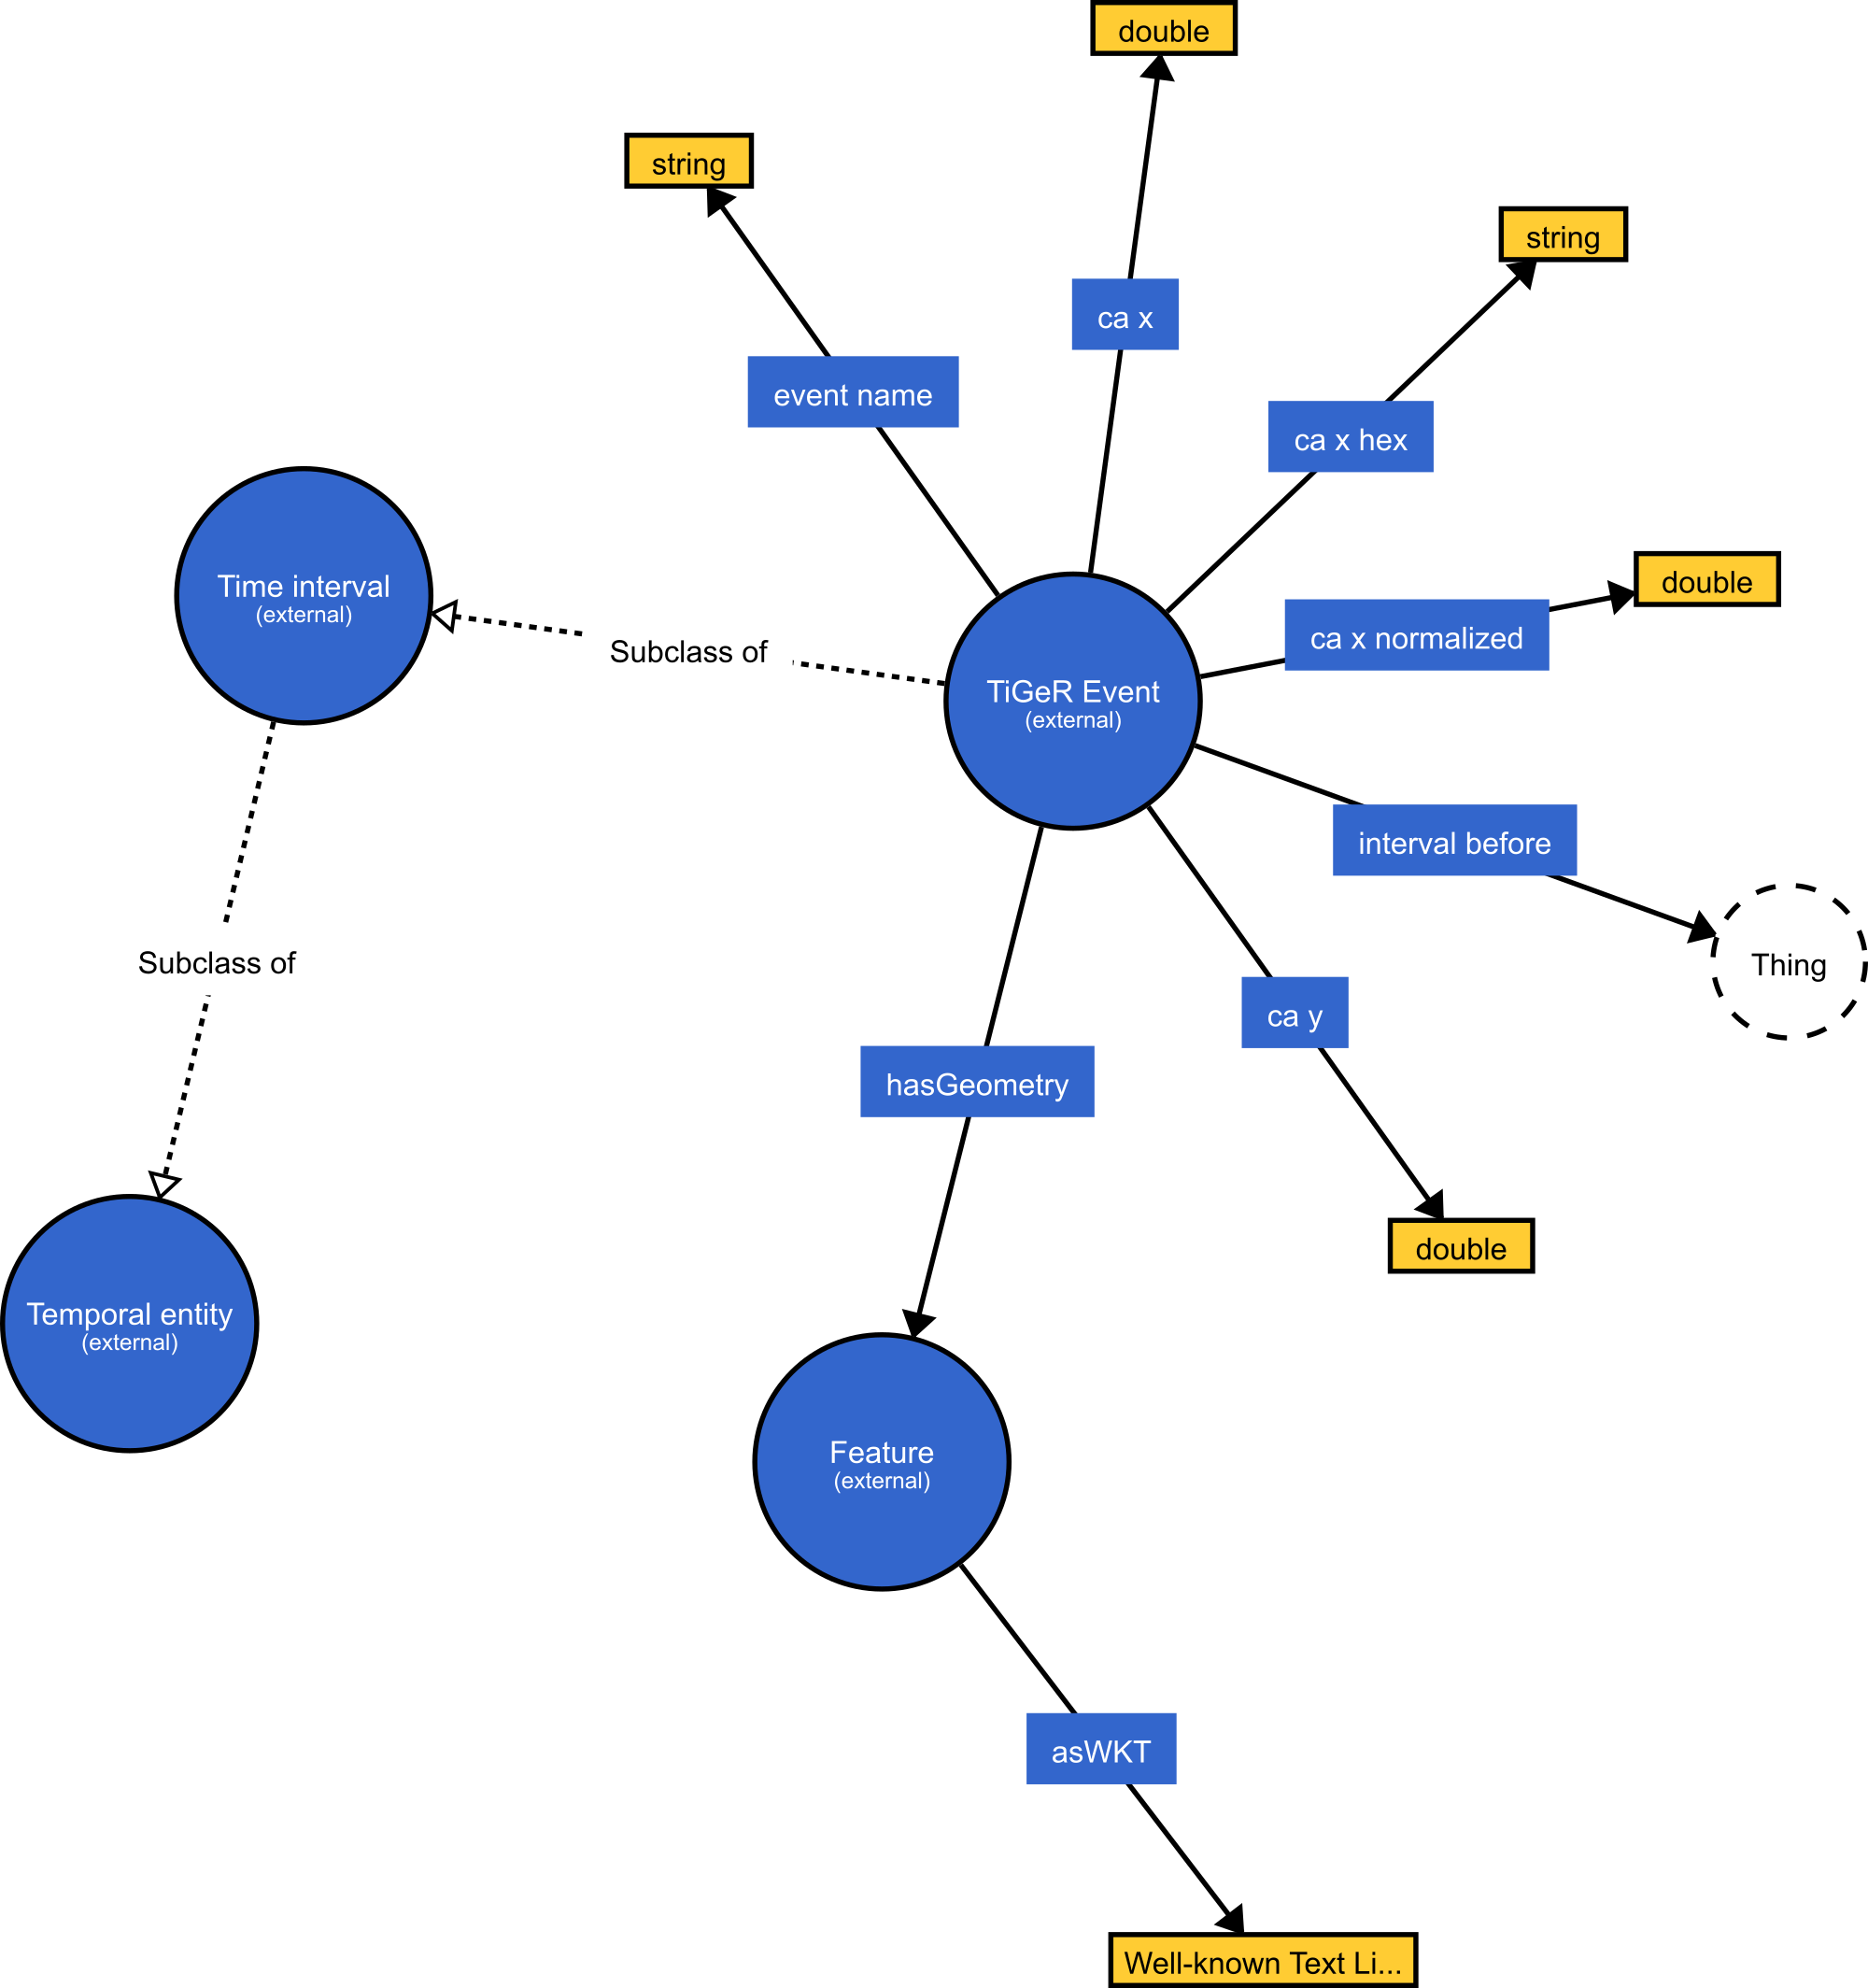
The TiGeR ontology, via https://leiza-rse.github.io/tiger/vocab/. Graphic: Florian Thiery, CC BY 4.0
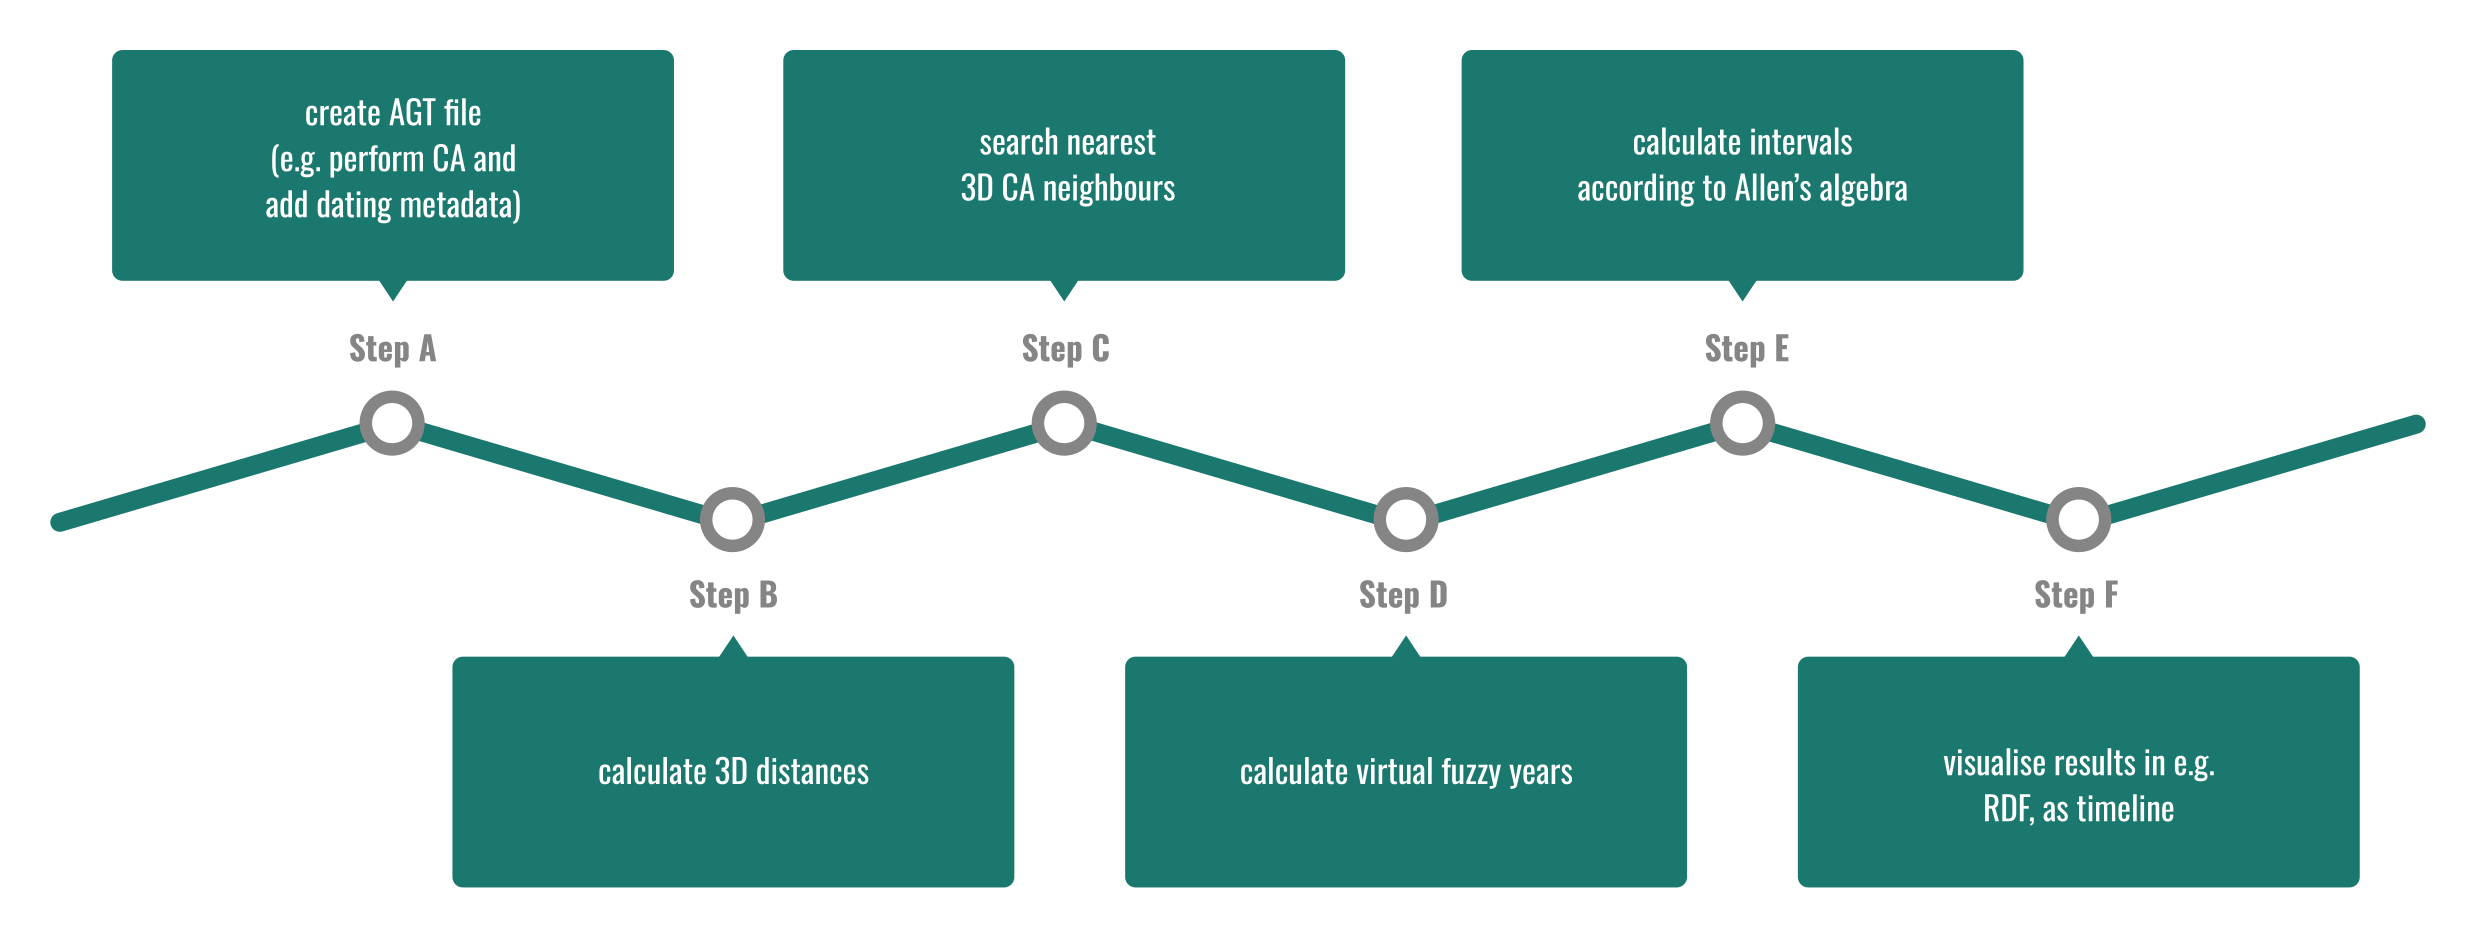
The Alligator Method steps A to F. Graphic: Florian Thiery, CC BY 4.0
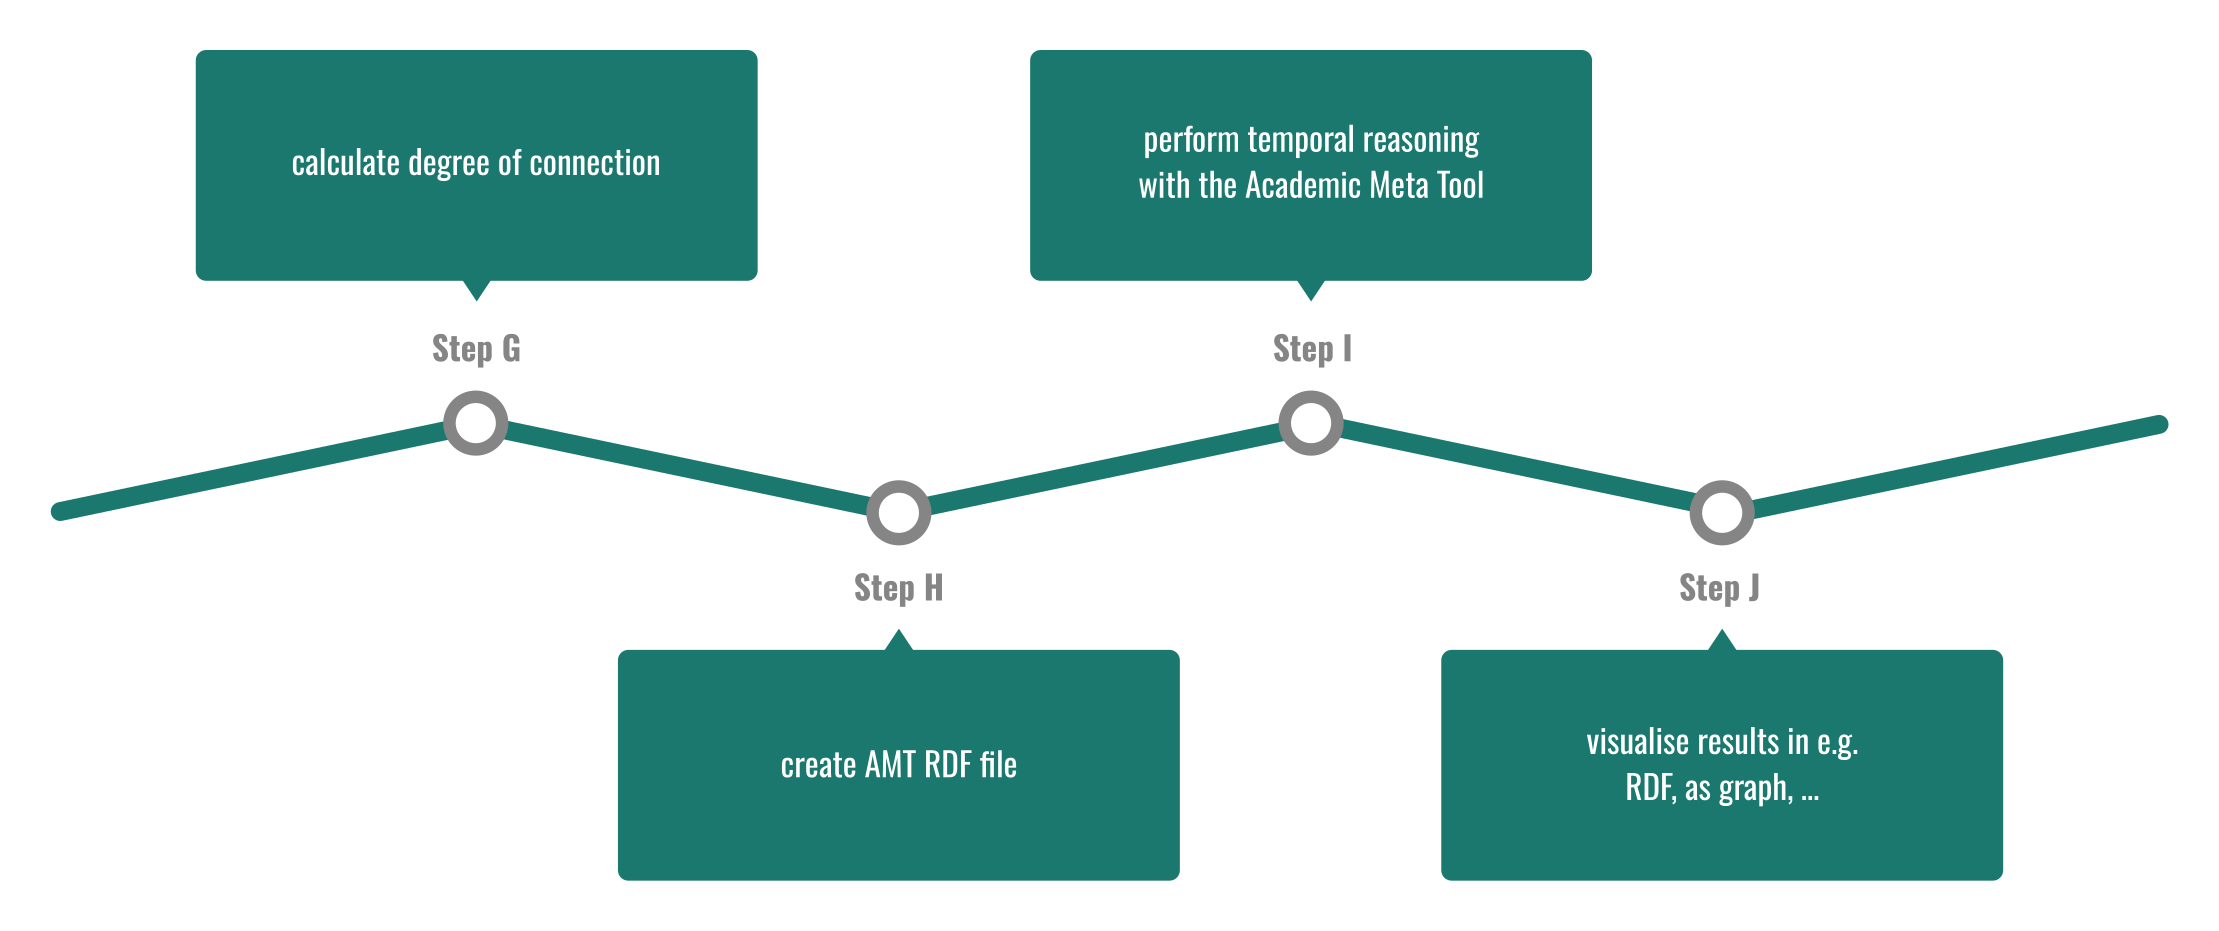
The Alligator Method steps G to J. Graphic: Florian Thiery, CC BY 4.0
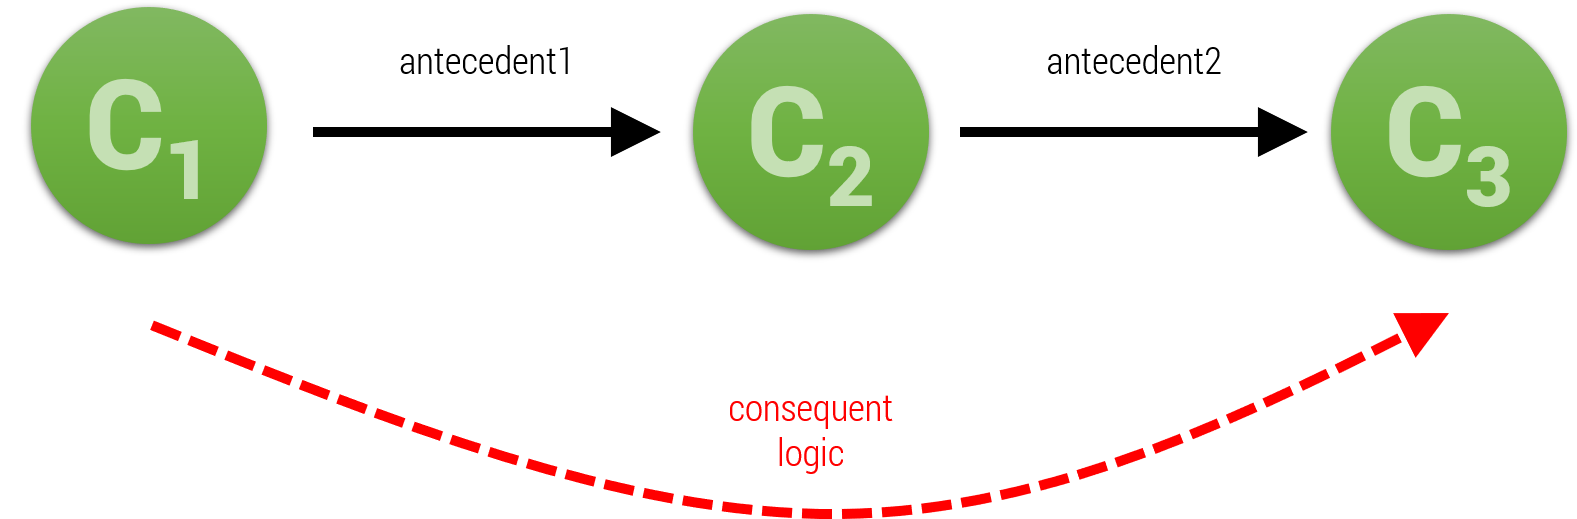
Academic Meta Tool Role-Chain-Axiom (schematic representation). Graphic: Florian Thiery / Martin Unold, CC BY 4.0, via Wikimedia Commons
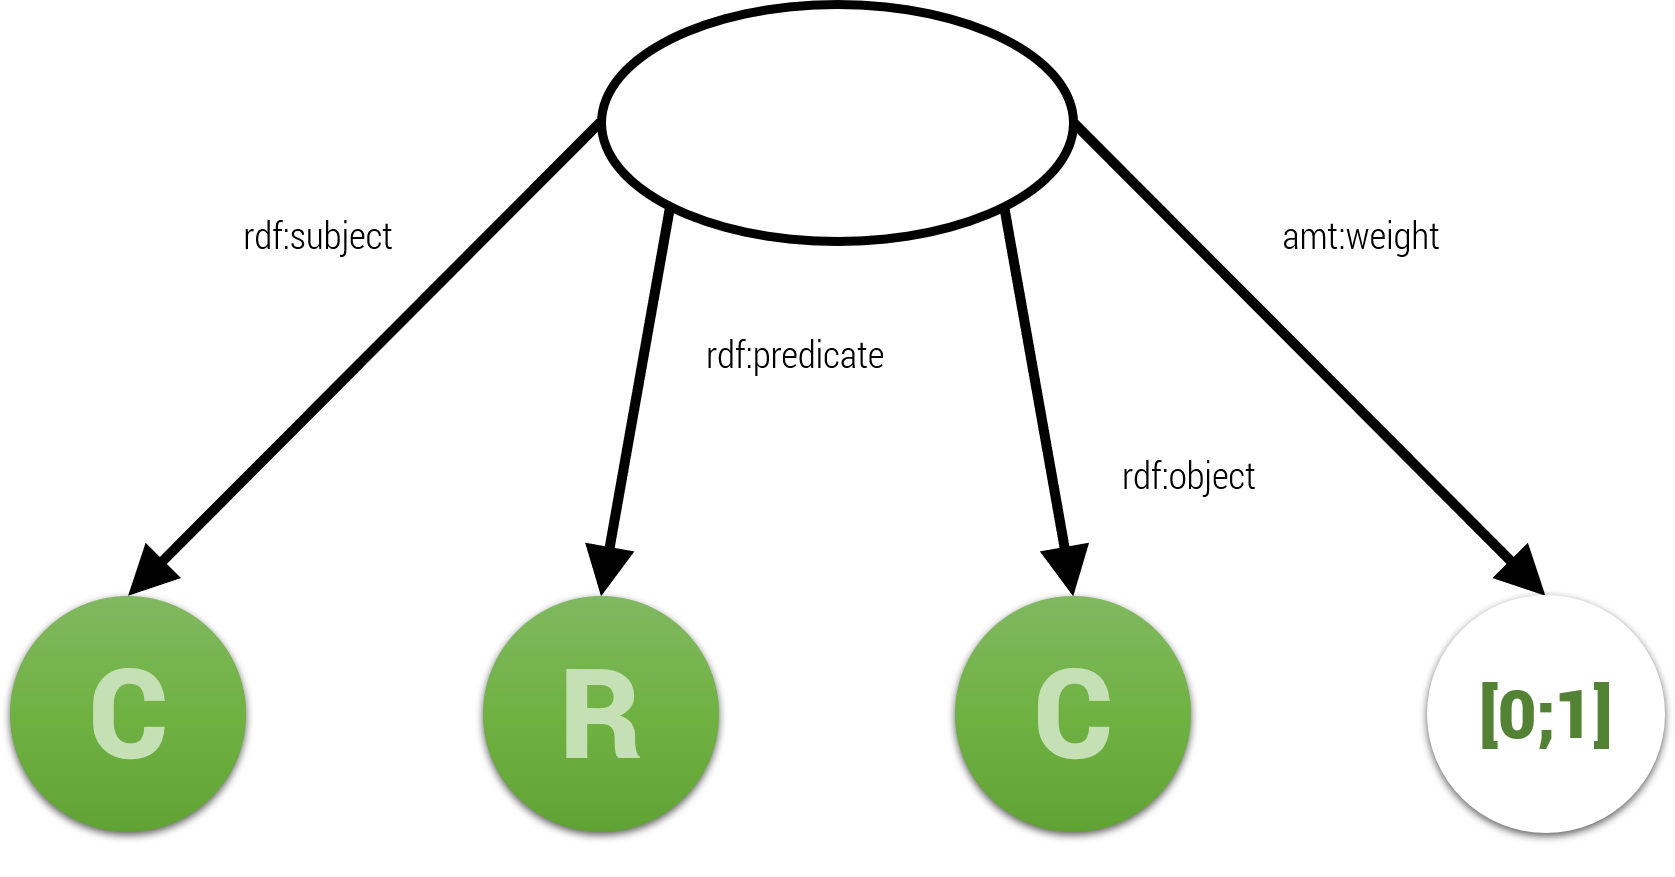
Academic Meta Tool Quadruple (schematic representation). Graphic: Florian Thiery / Martin Unold, CC BY 4.0, via Wikimedia Commons
Results
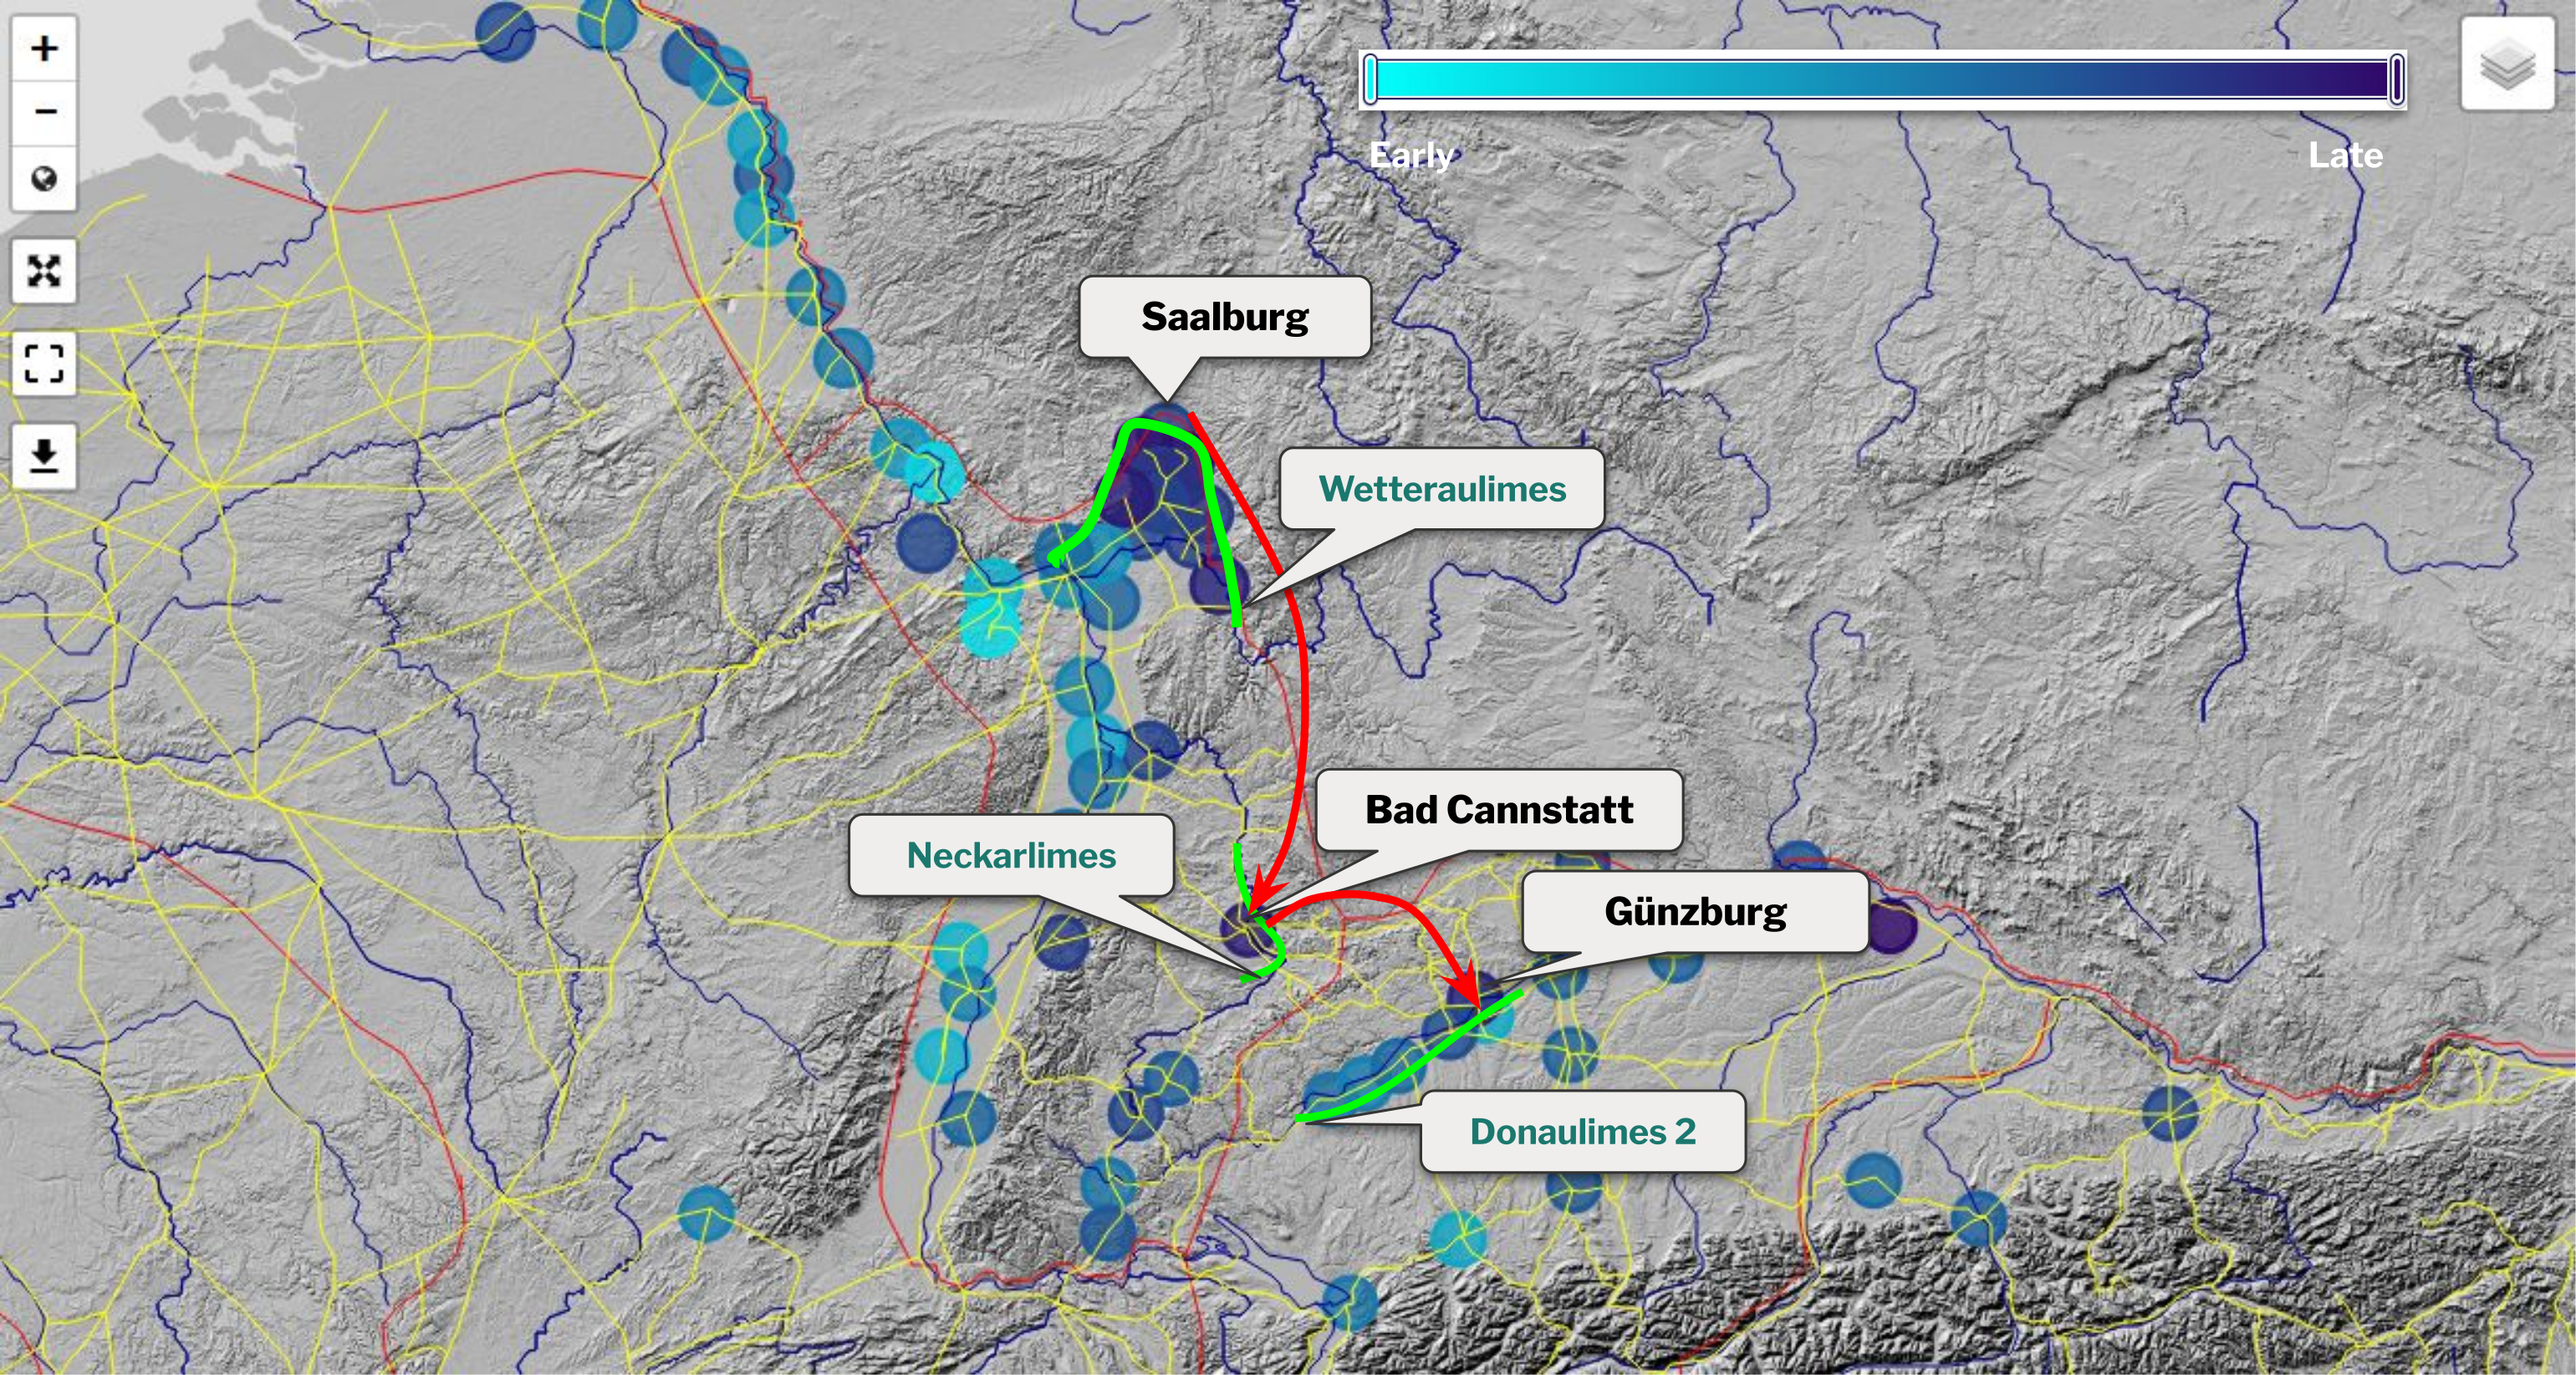
The Saalburg and its temporal neighbors on a Map. Graphic: Florian Thiery / Allard Mees, CC BY 4.0
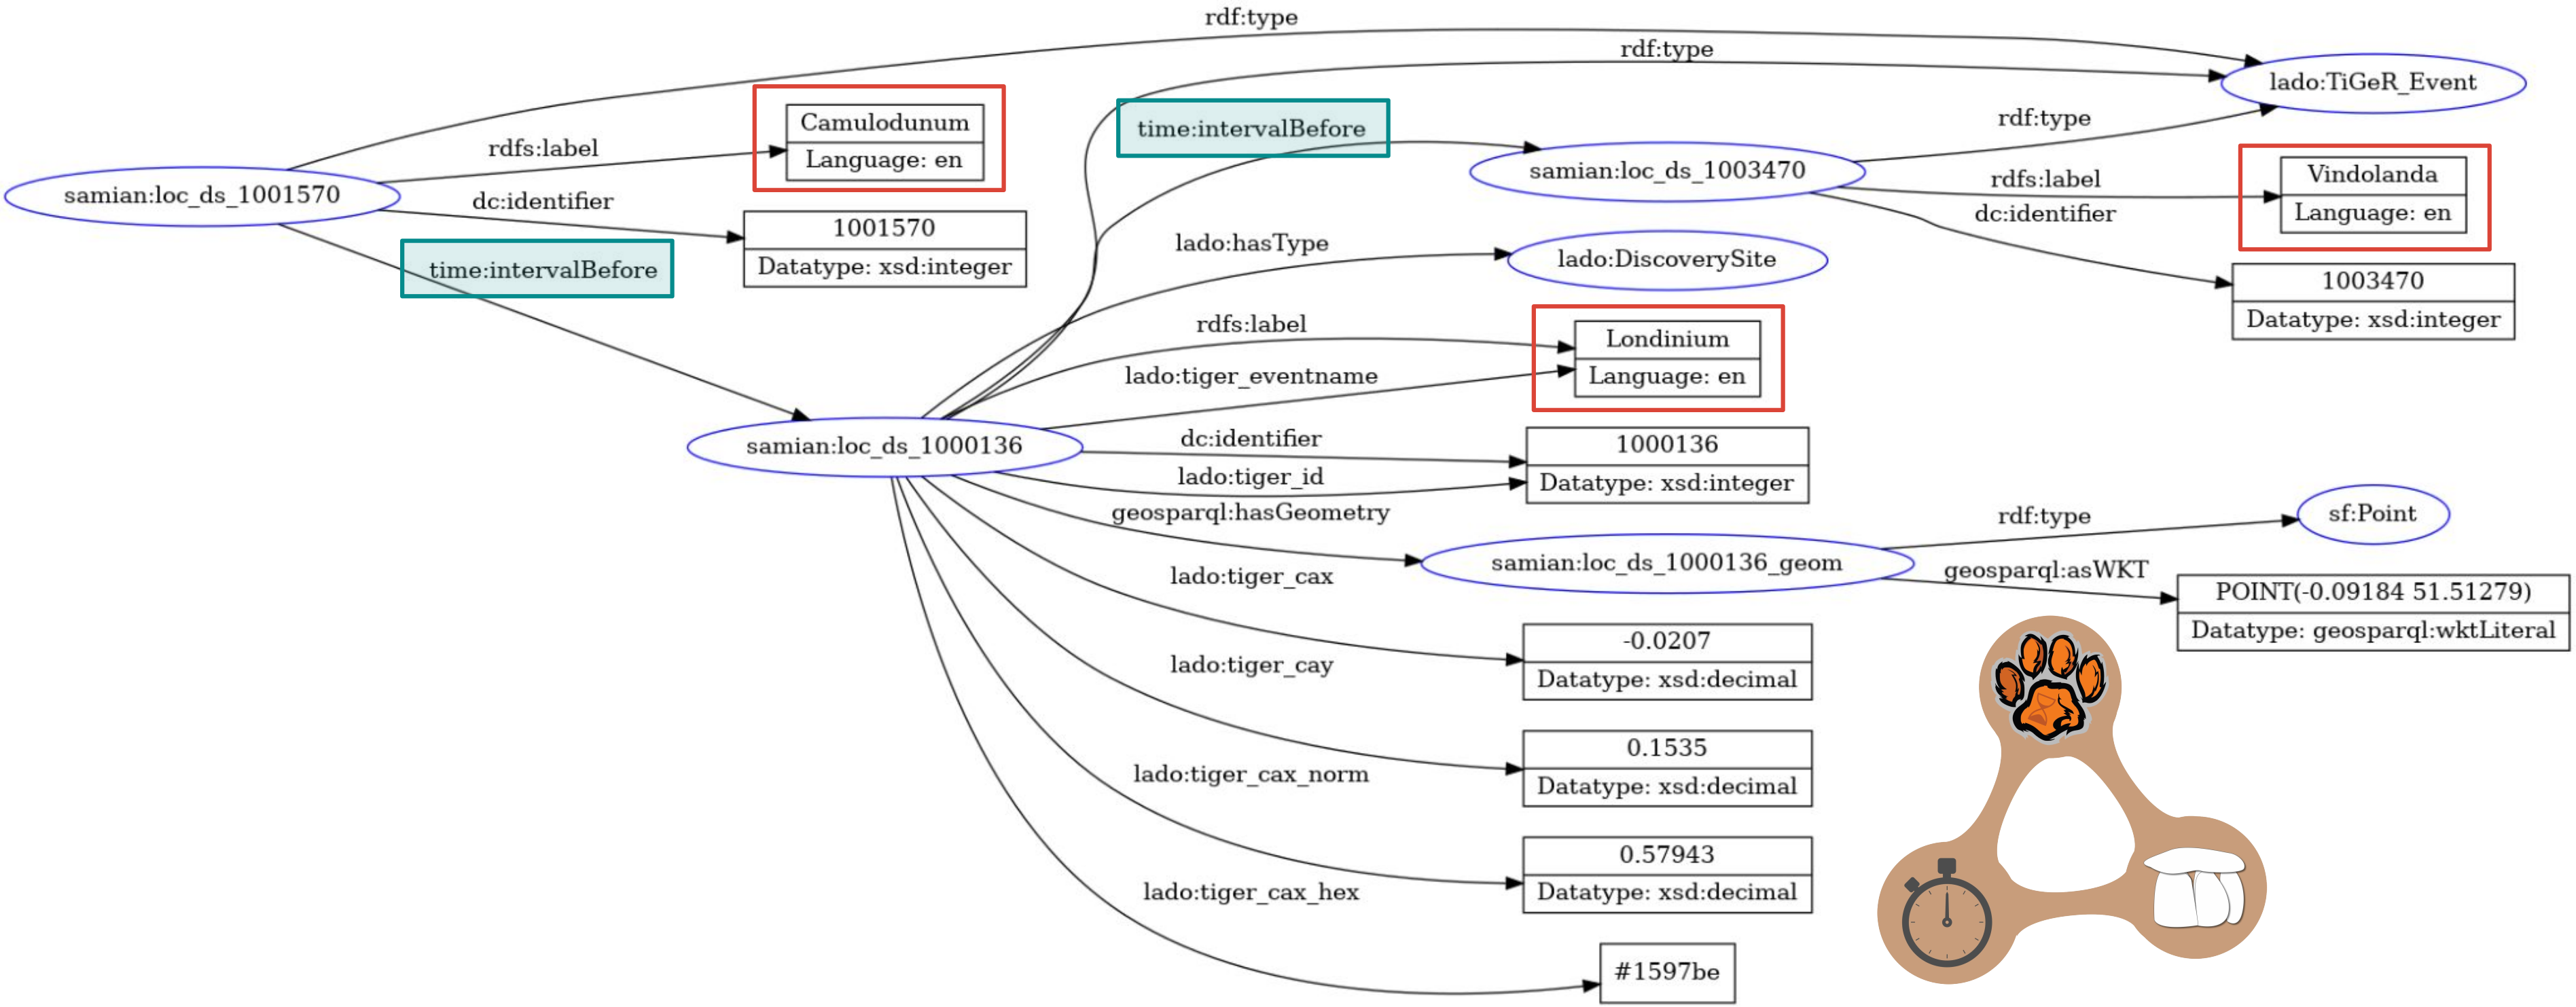
Londinium and its temporal (before) neighbors (red boxes) as RDF, created with https://www.ldf.fi/service/rdf-grapher. Graphic: Florian Thiery, CC BY 4.0
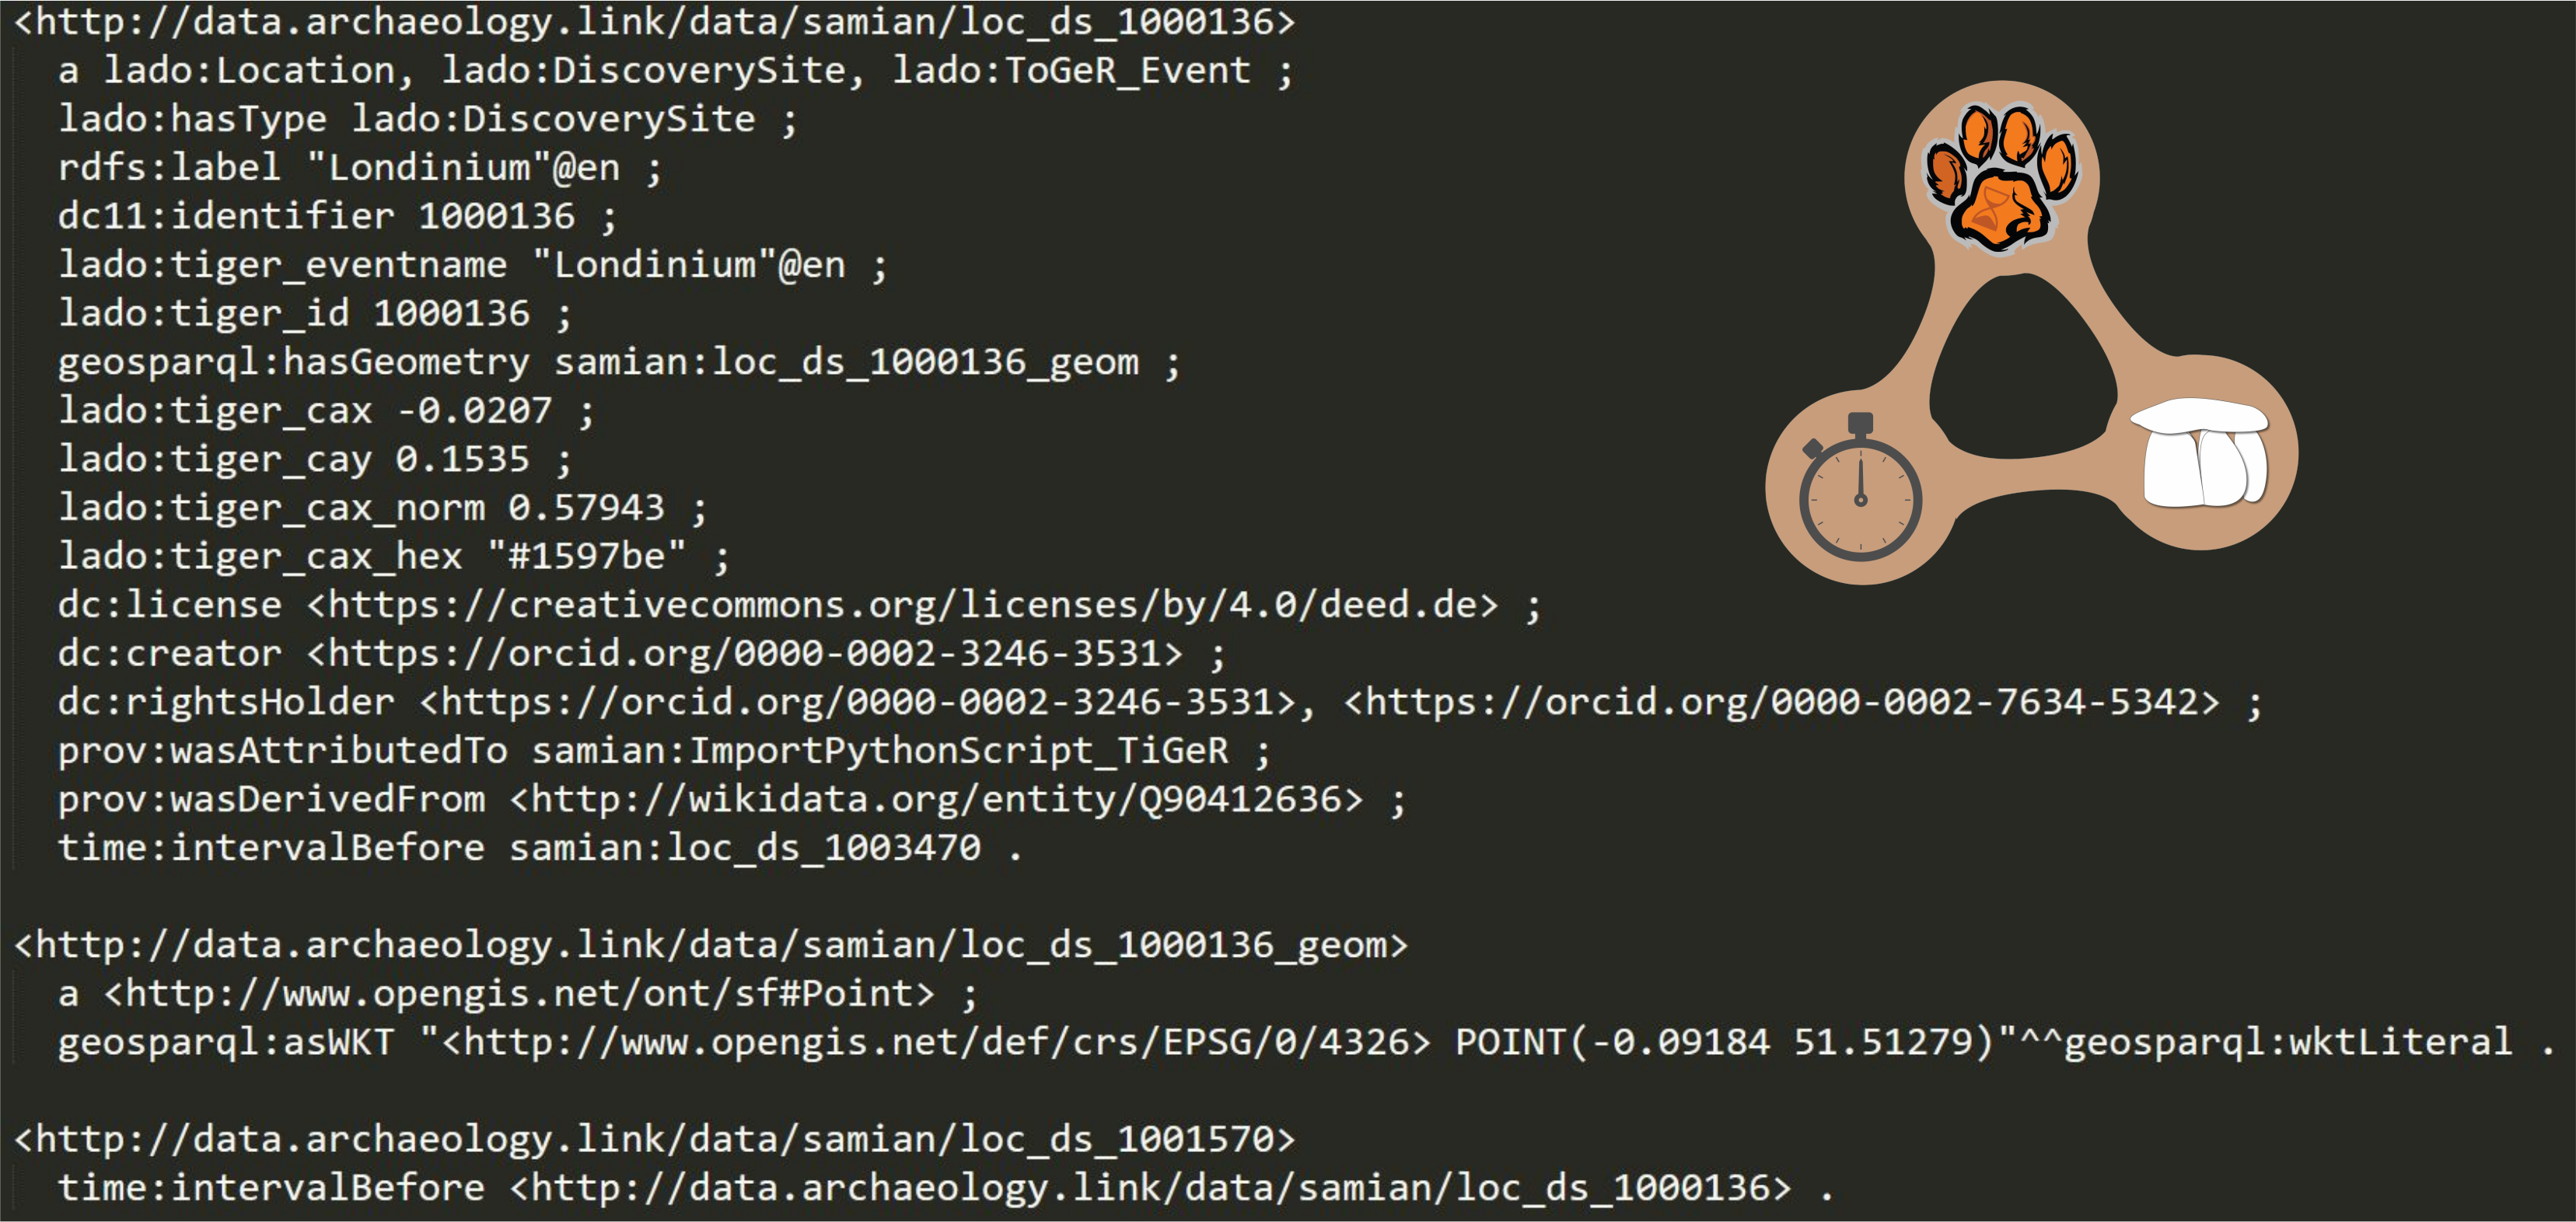
Londinium as RDF using the TiGeR ontology. Graphic: Florian Thiery, CC BY 4.0
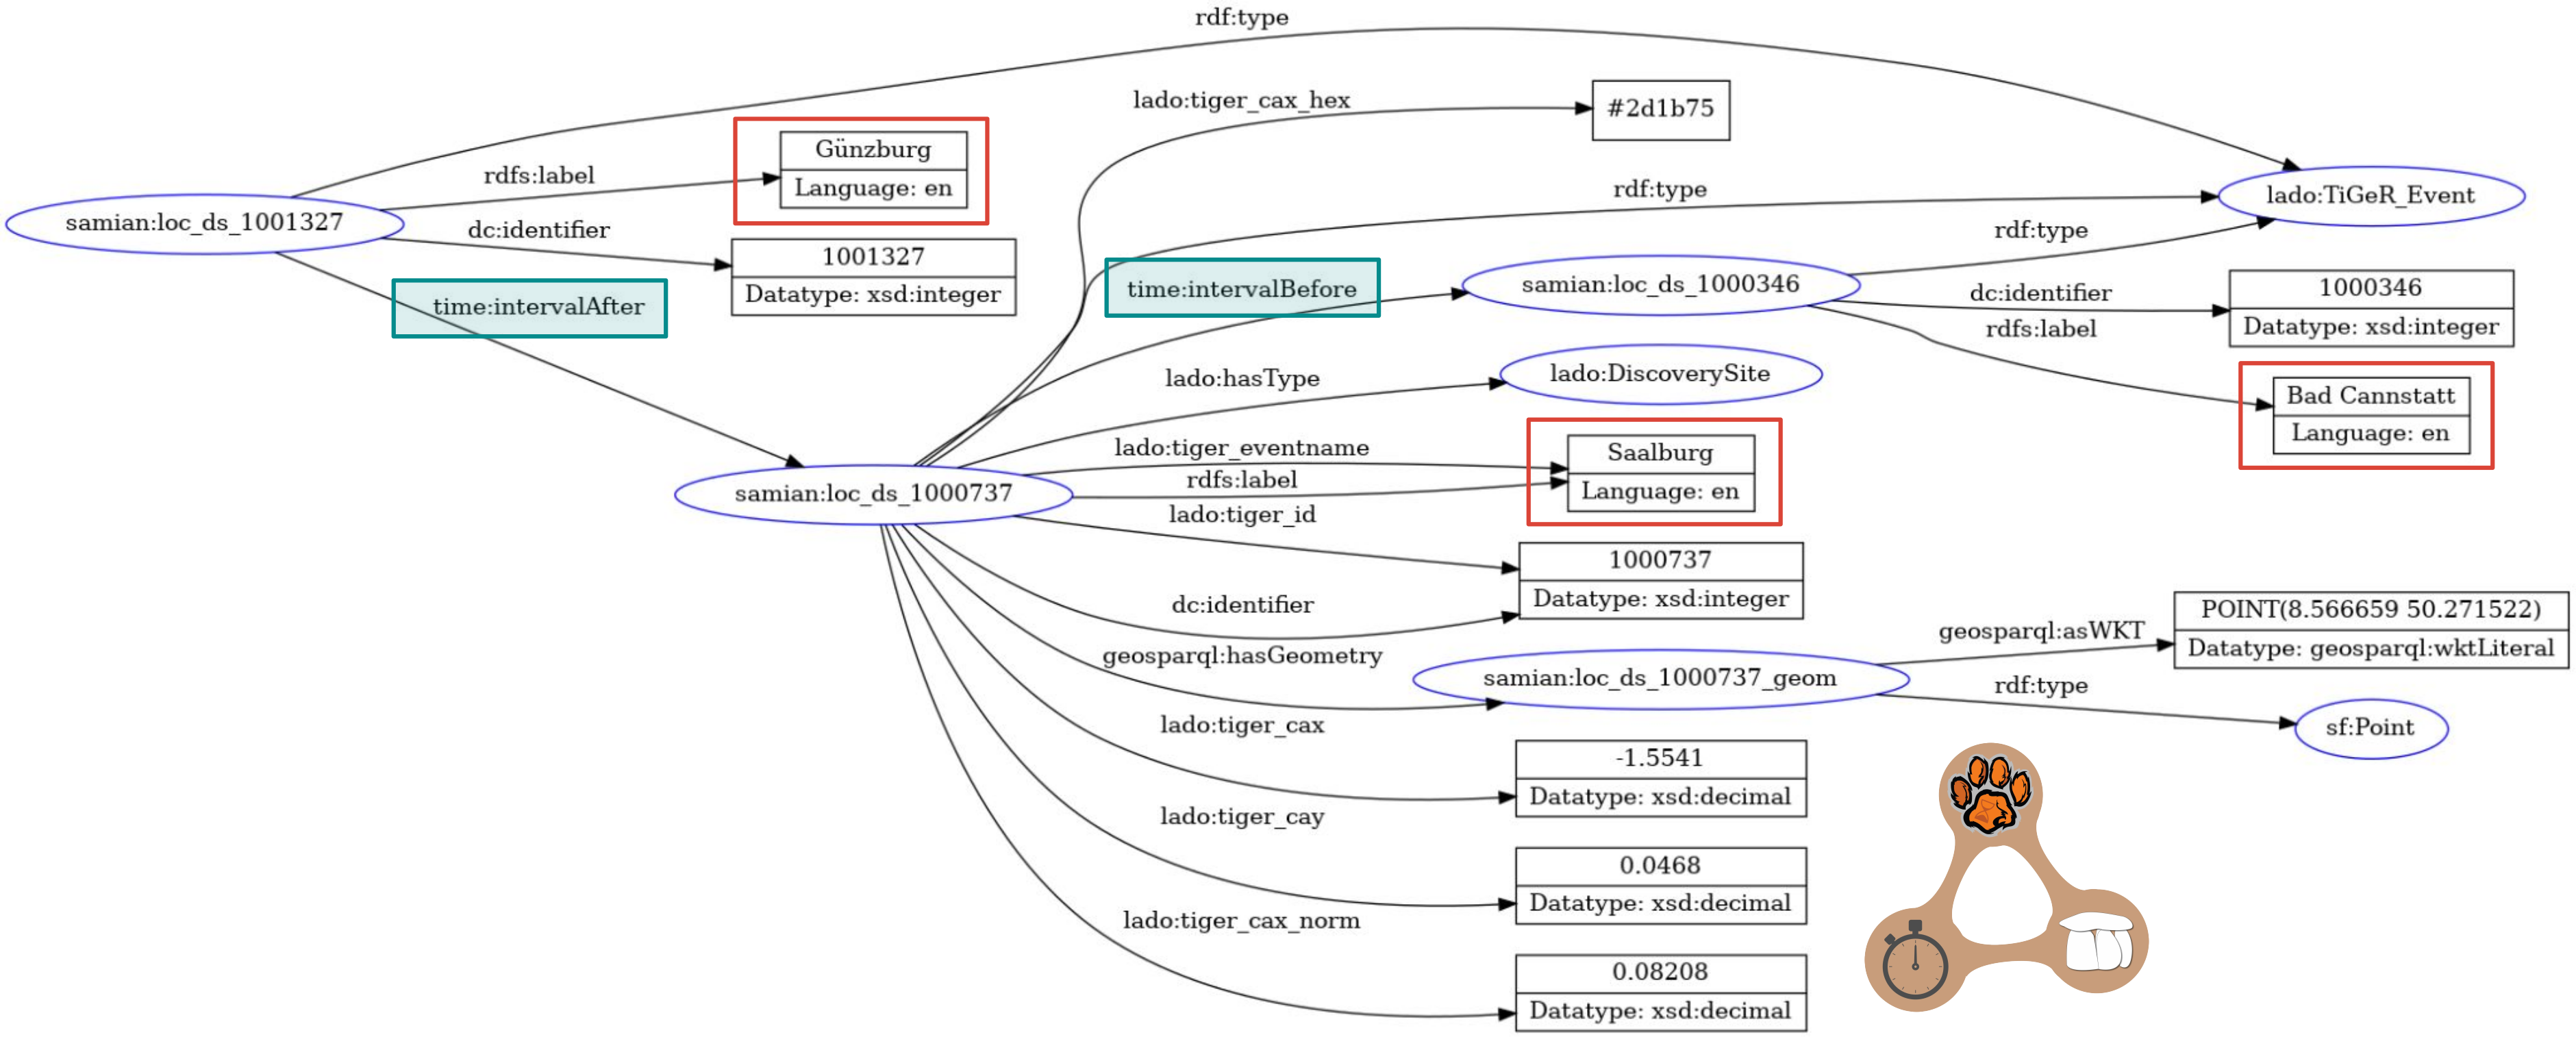
The Saalburg and its temporal (before) neighbors (red boxes) as RDF, created with https://www.ldf.fi/service/rdf-grapher. Graphic: Florian Thiery, CC BY 4.0
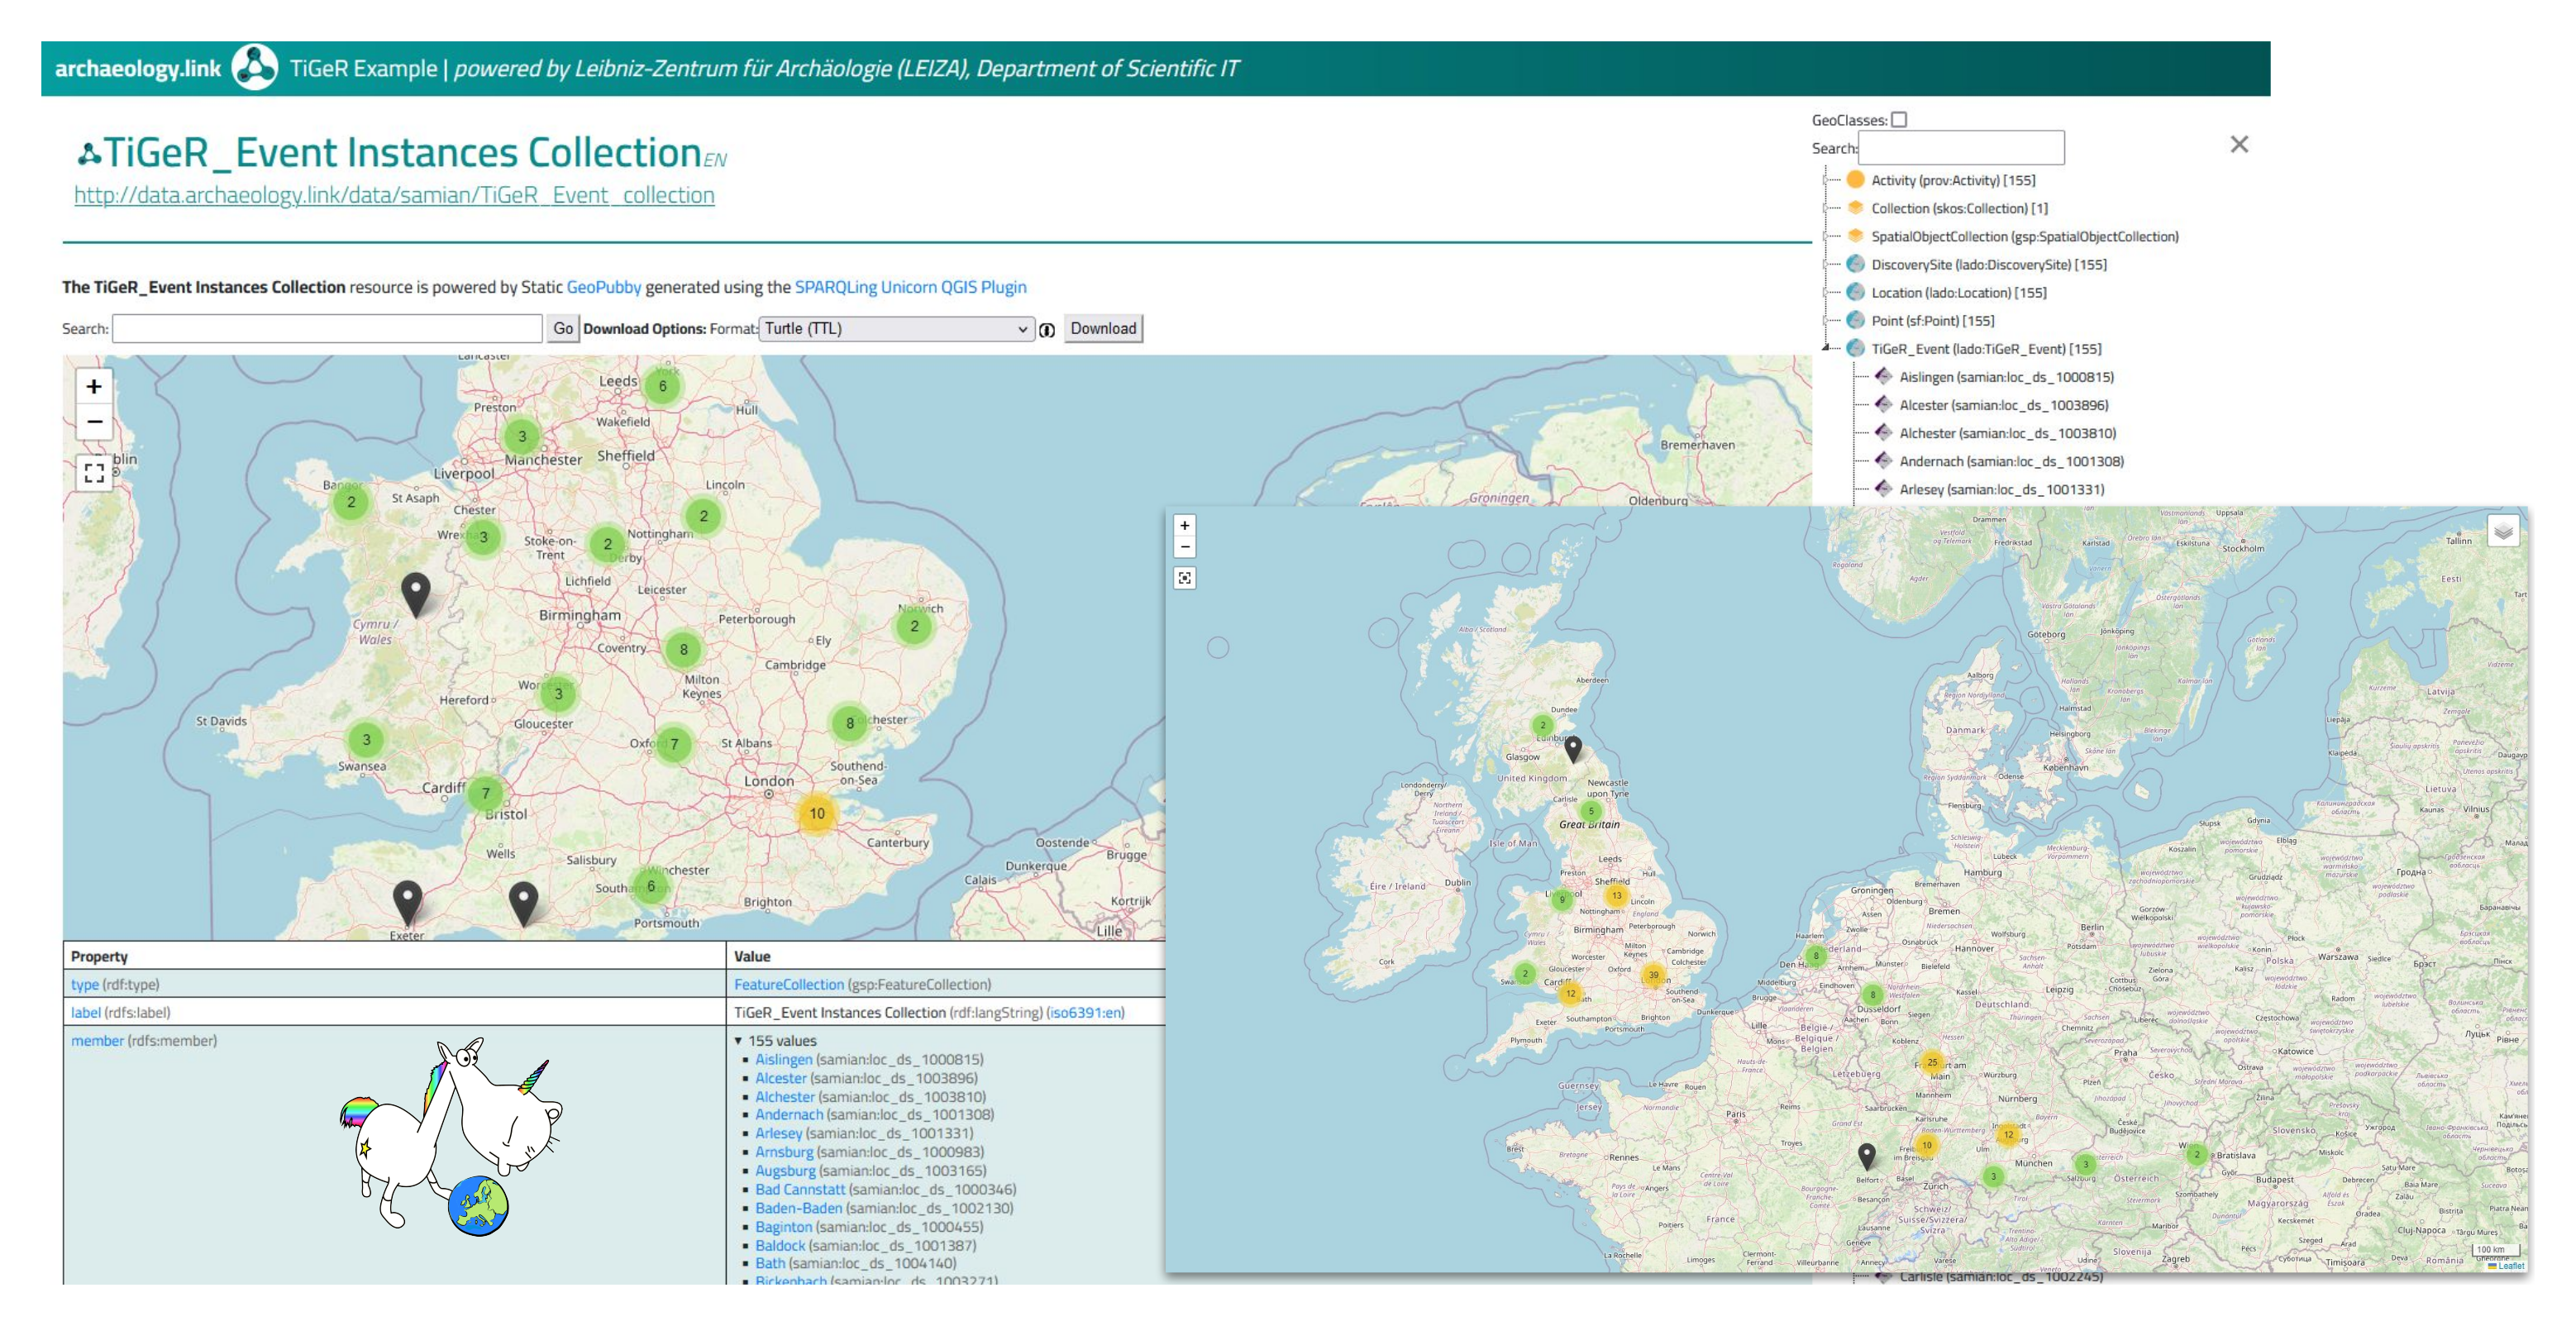
All TiGeR-Event Sites as a Feature Collection , created with the SPARQL Unicorn Ontology Documentation tool as an HTML Page generator in GitHub Actions. Graphic: Florian Thiery CC BY 4.0
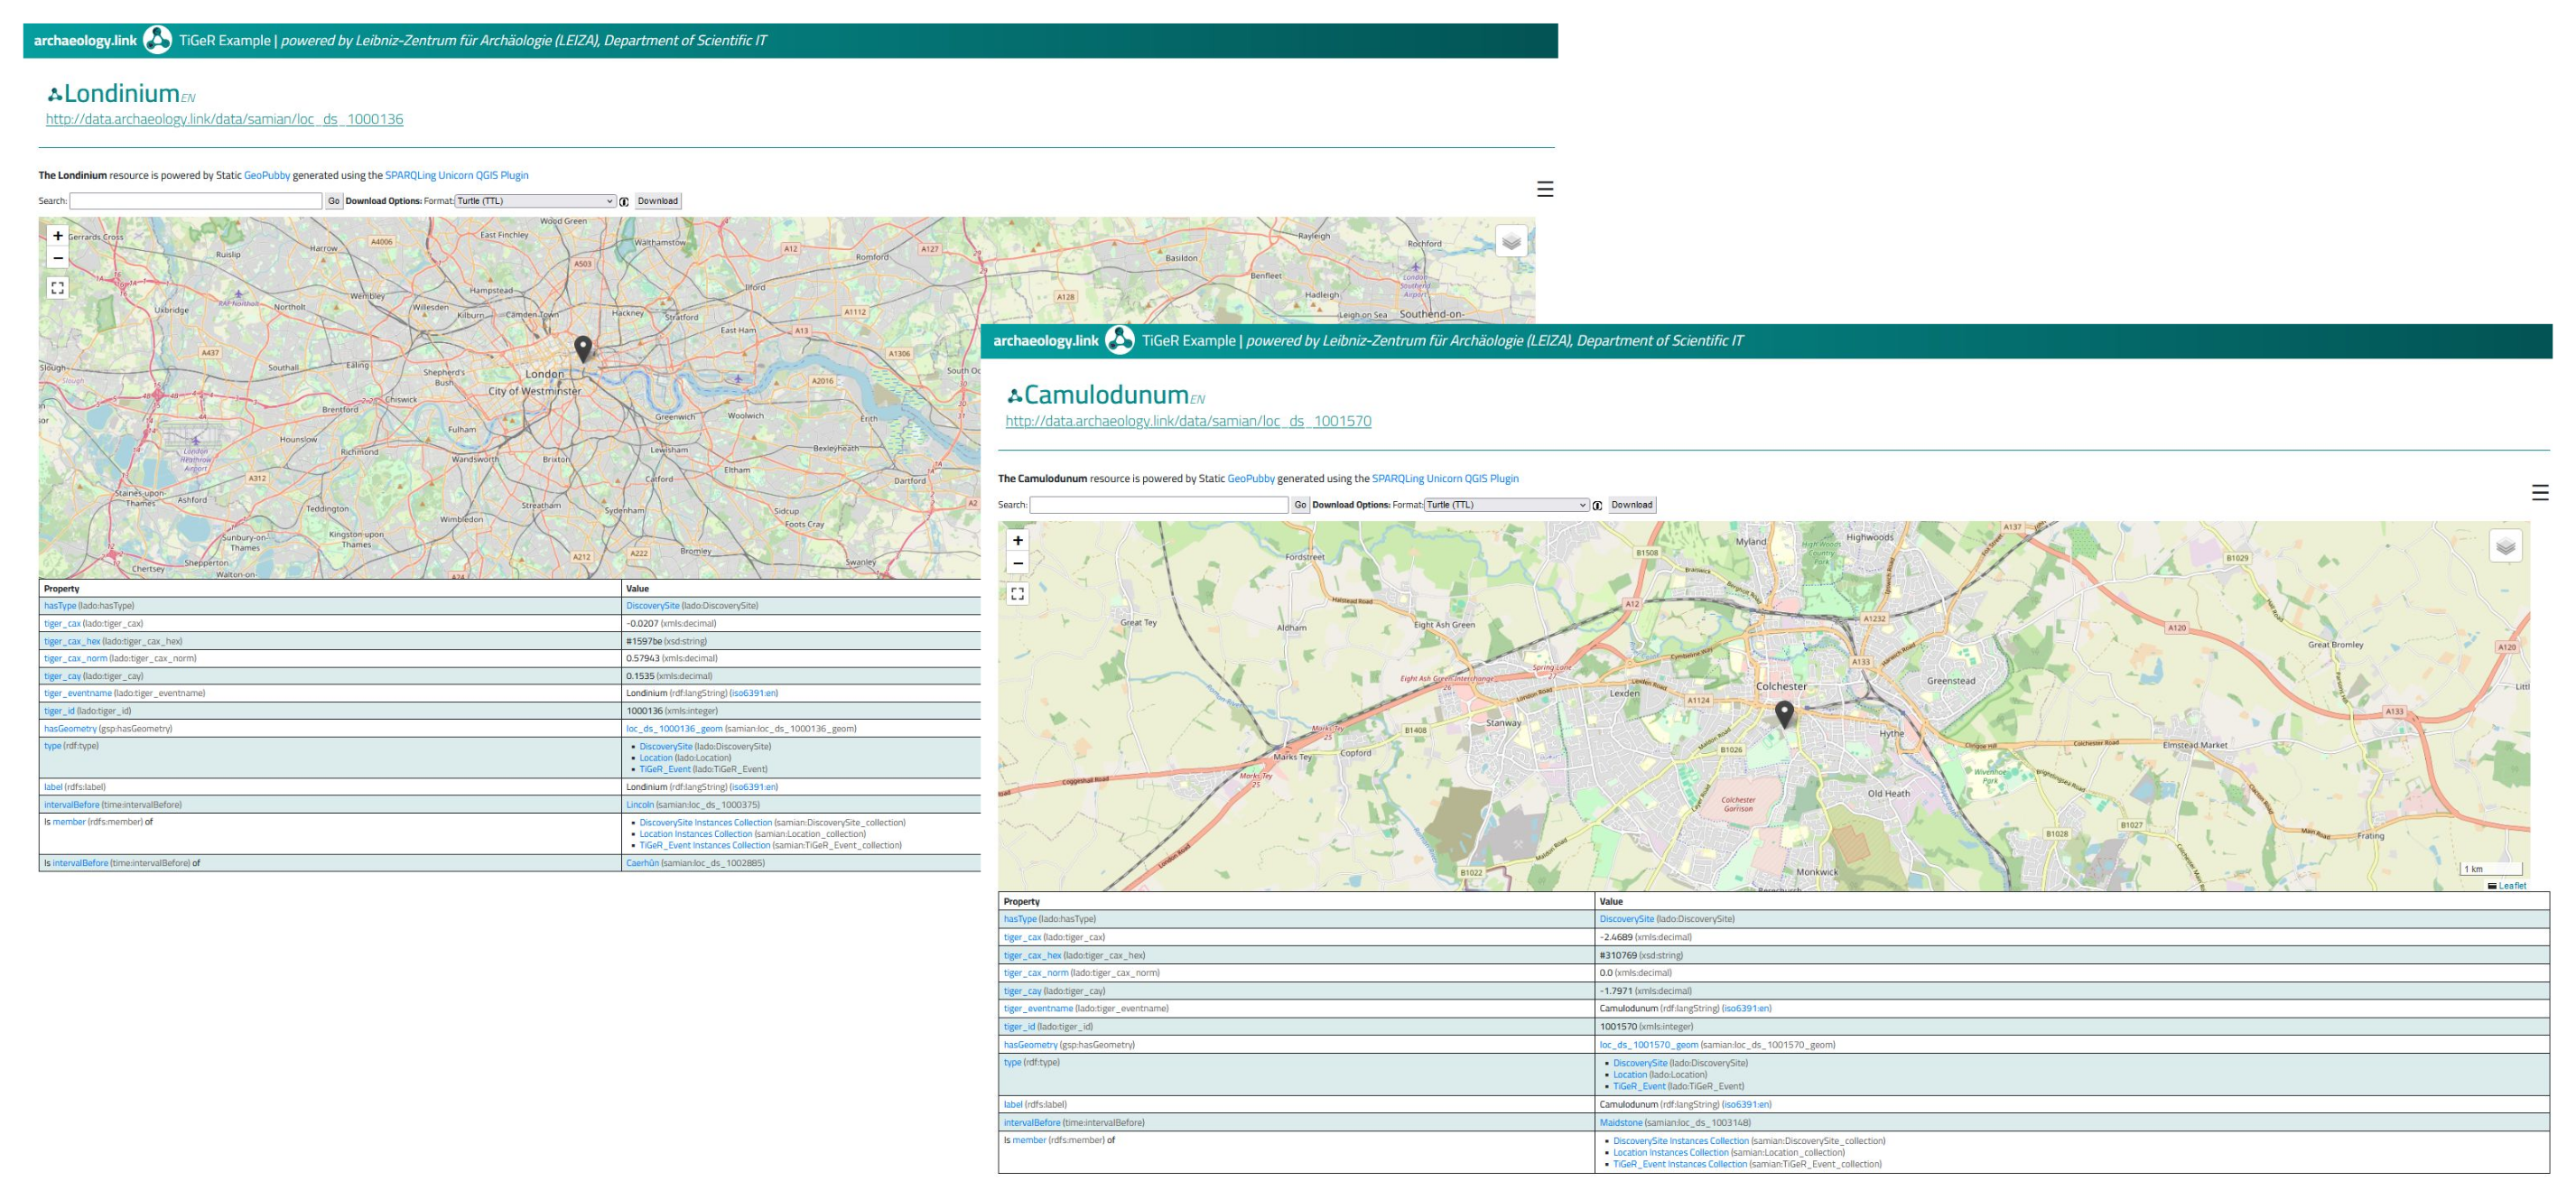
The Londinium (left) and Camulodunum site TiGeR-results as LOD HTML Page, created with the SPARQL Unicorn Ontology Documentation tool as an HTML Page generator in GitHub Actions. Graphic: Florian Thiery, CC BY 4.0
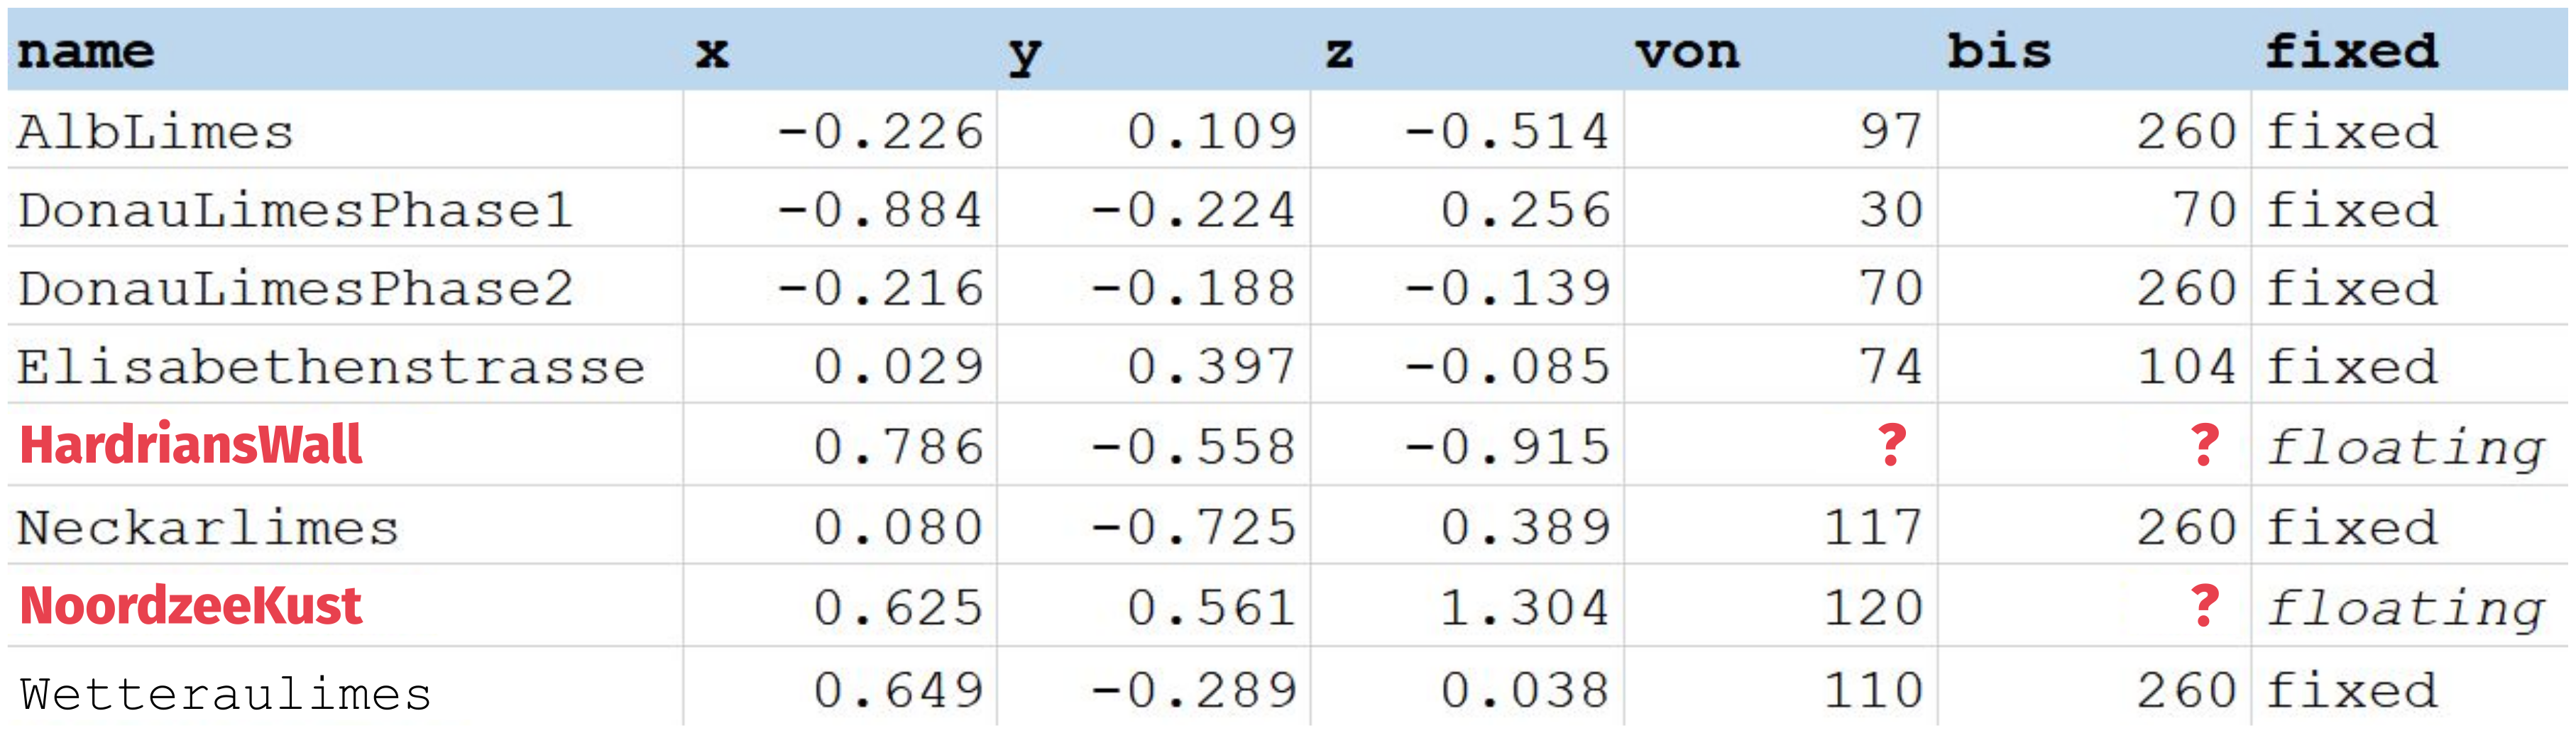
Floating intervals for Limes sections (red): Hadrian’s Wall and the North Sea Coast. Graphic: Florian Thiery / Allard W. Mees, CC BY 4.0
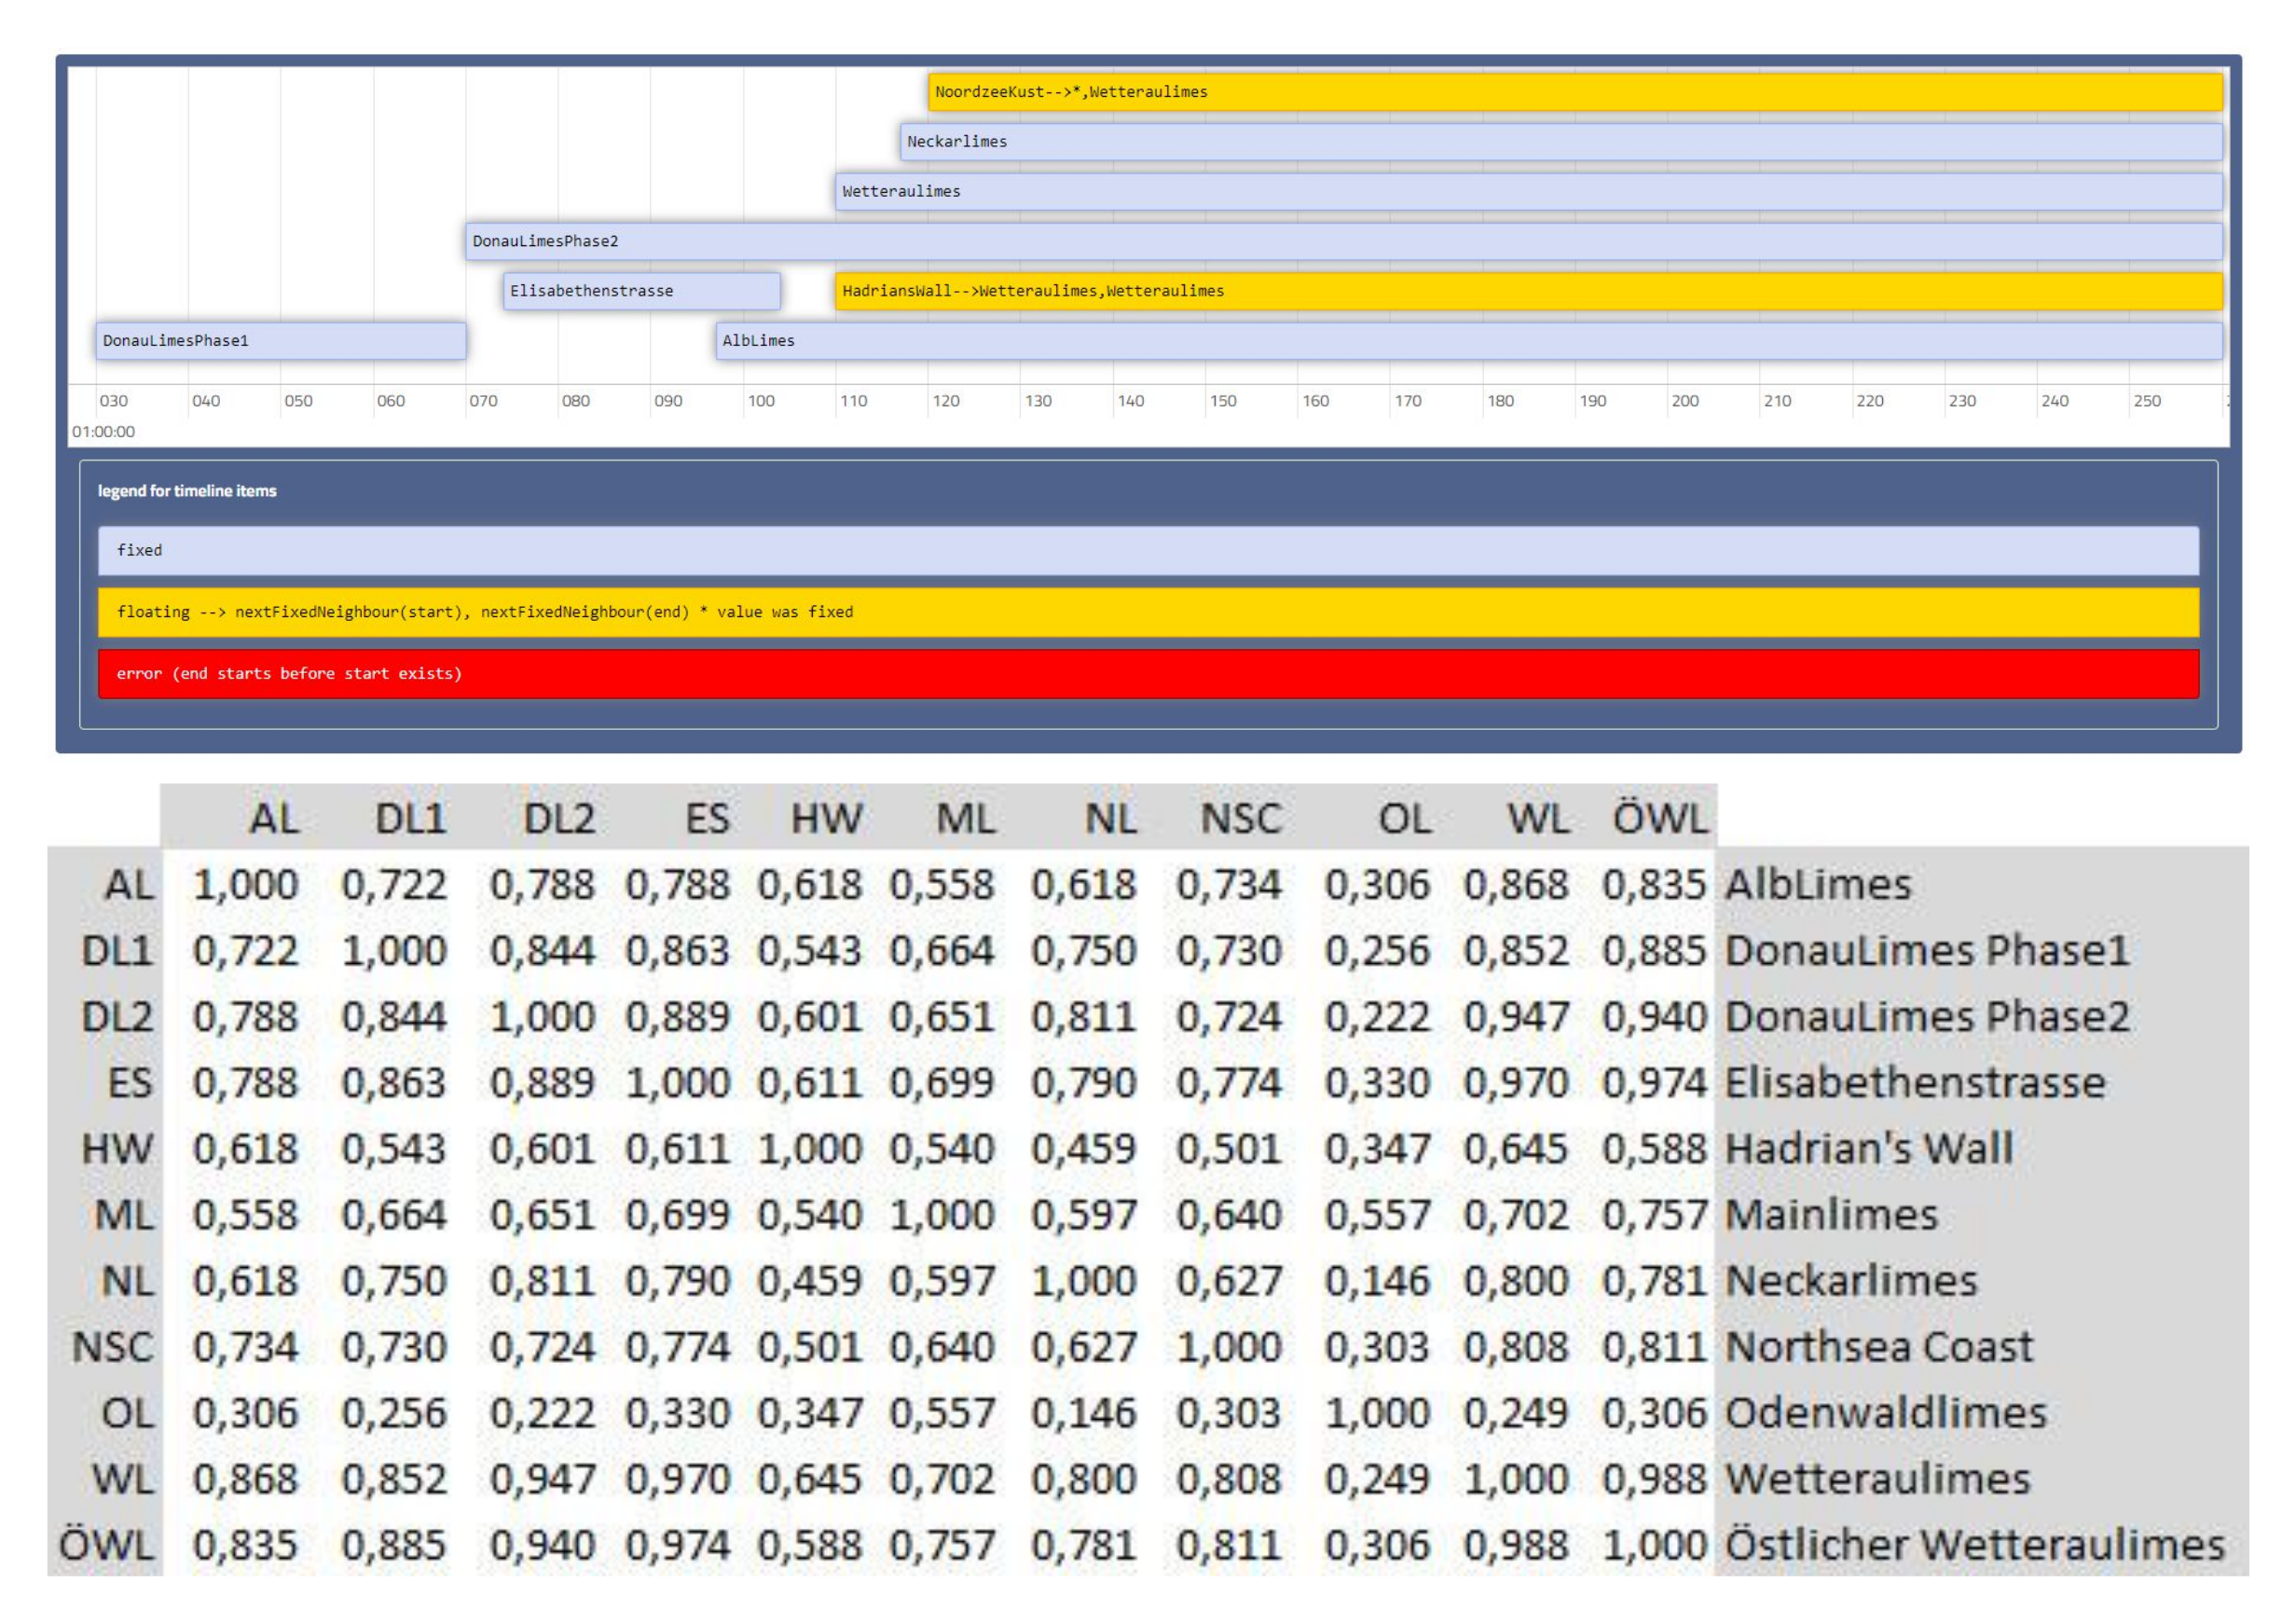
Top: Virtual Timeline. Bottom: The potter’s overlap of the Limes parts can be described with the (normalized) Pearson correlation coefficient. Graphic: Florian Thiery / Allard W. Mees, CC BY 4.0
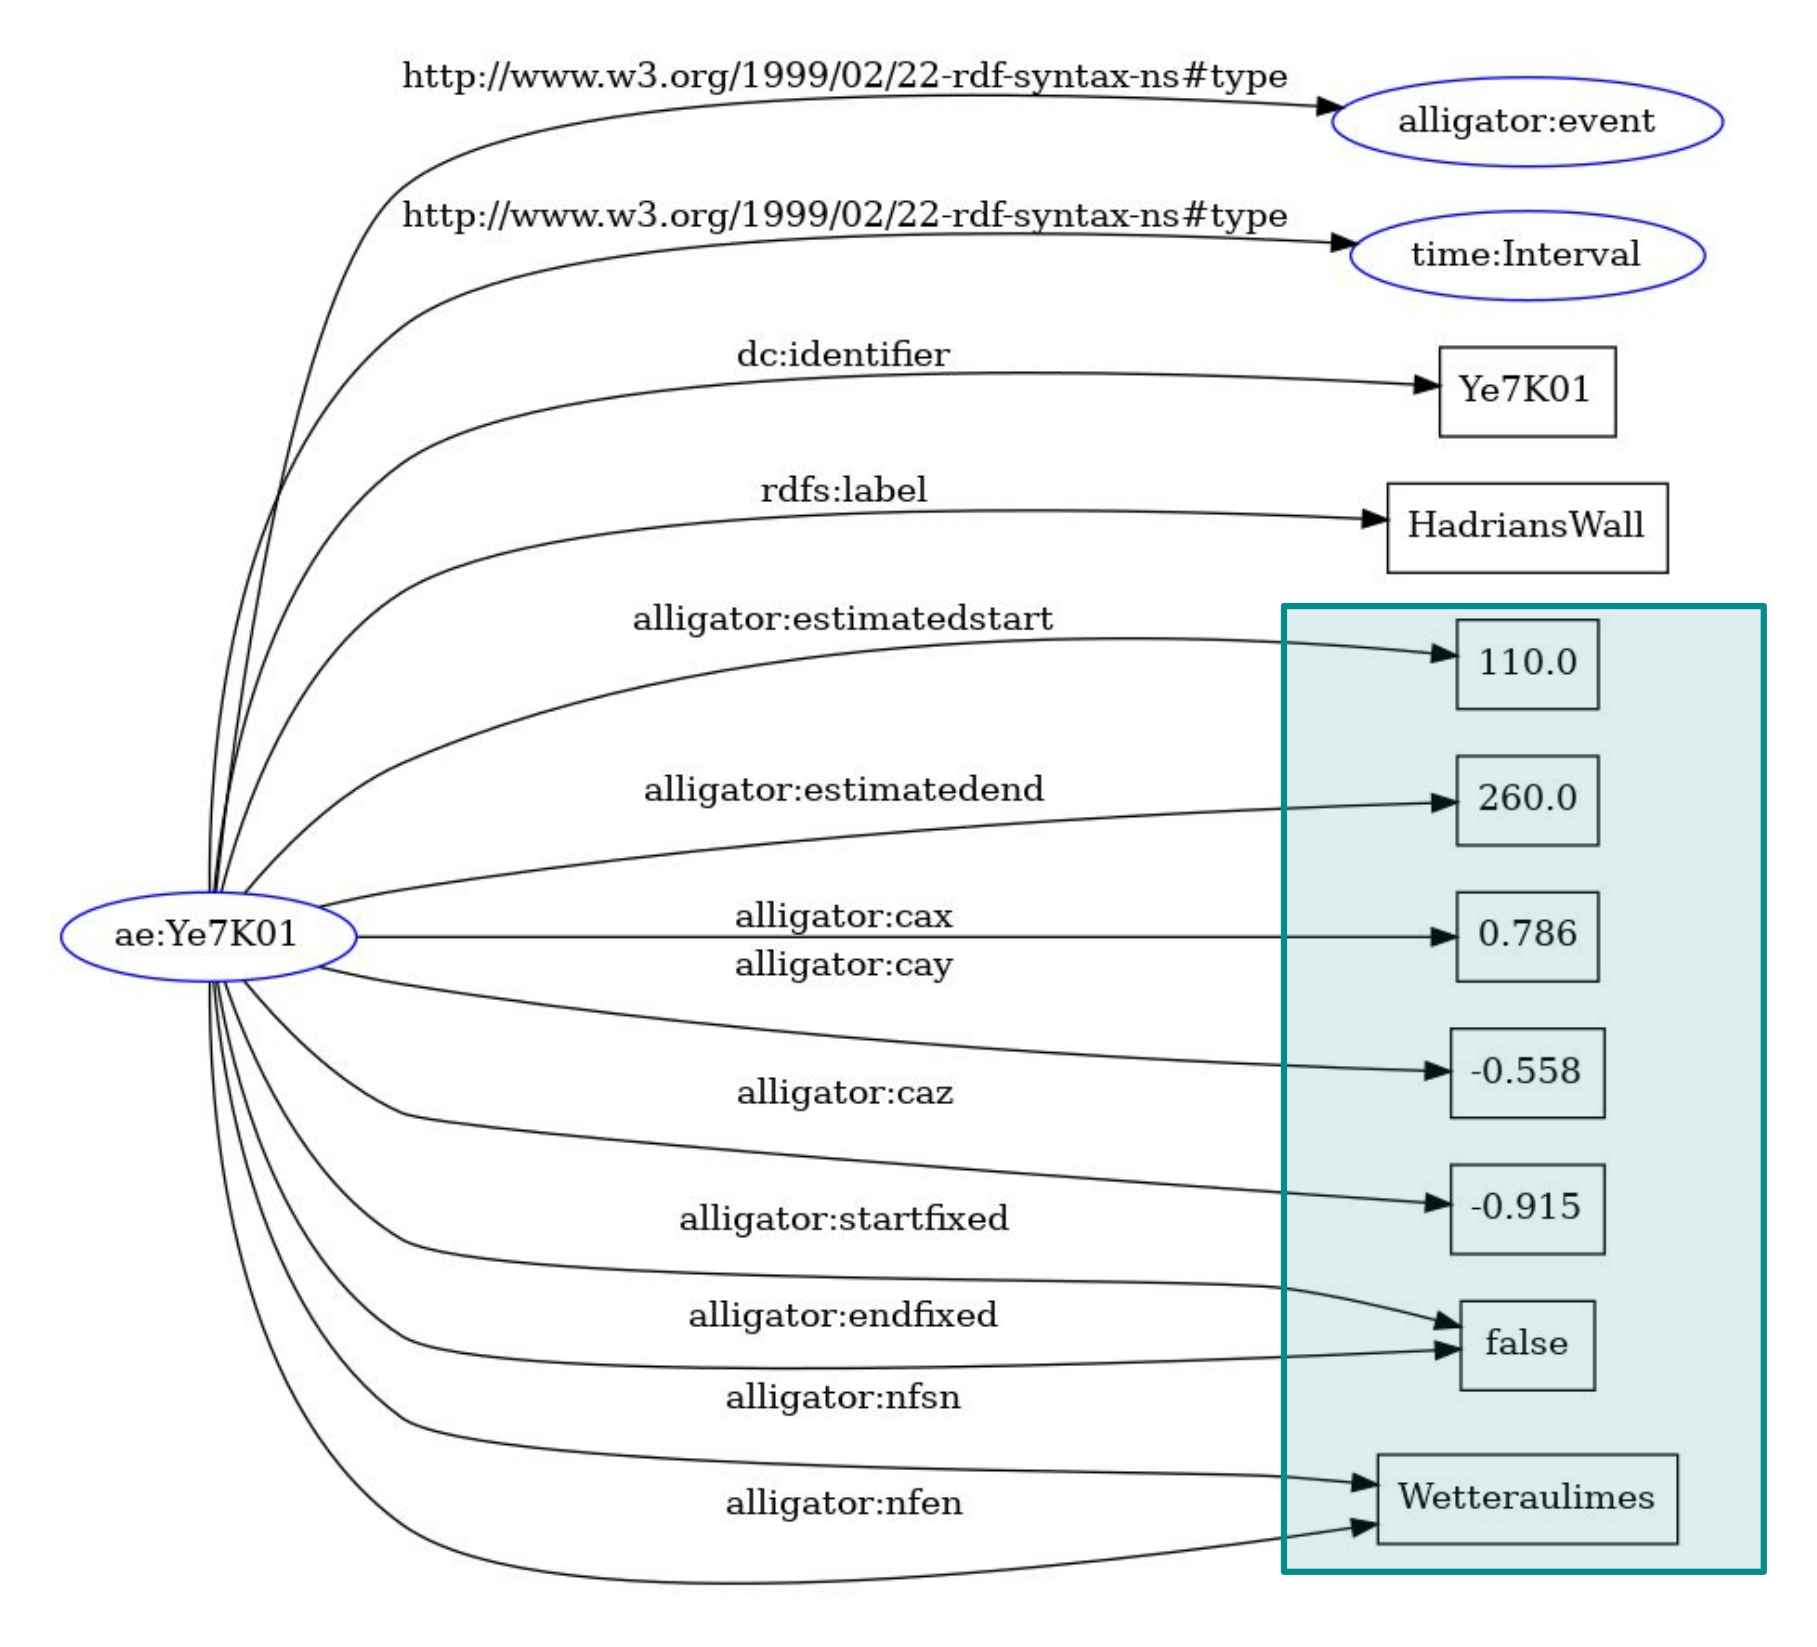
Hadrian’s Wall and the Alligator calculations as RDF, created with https://www.ldf.fi/service/rdf-grapher. Graphic: Florian Thiery CC BY 4.0
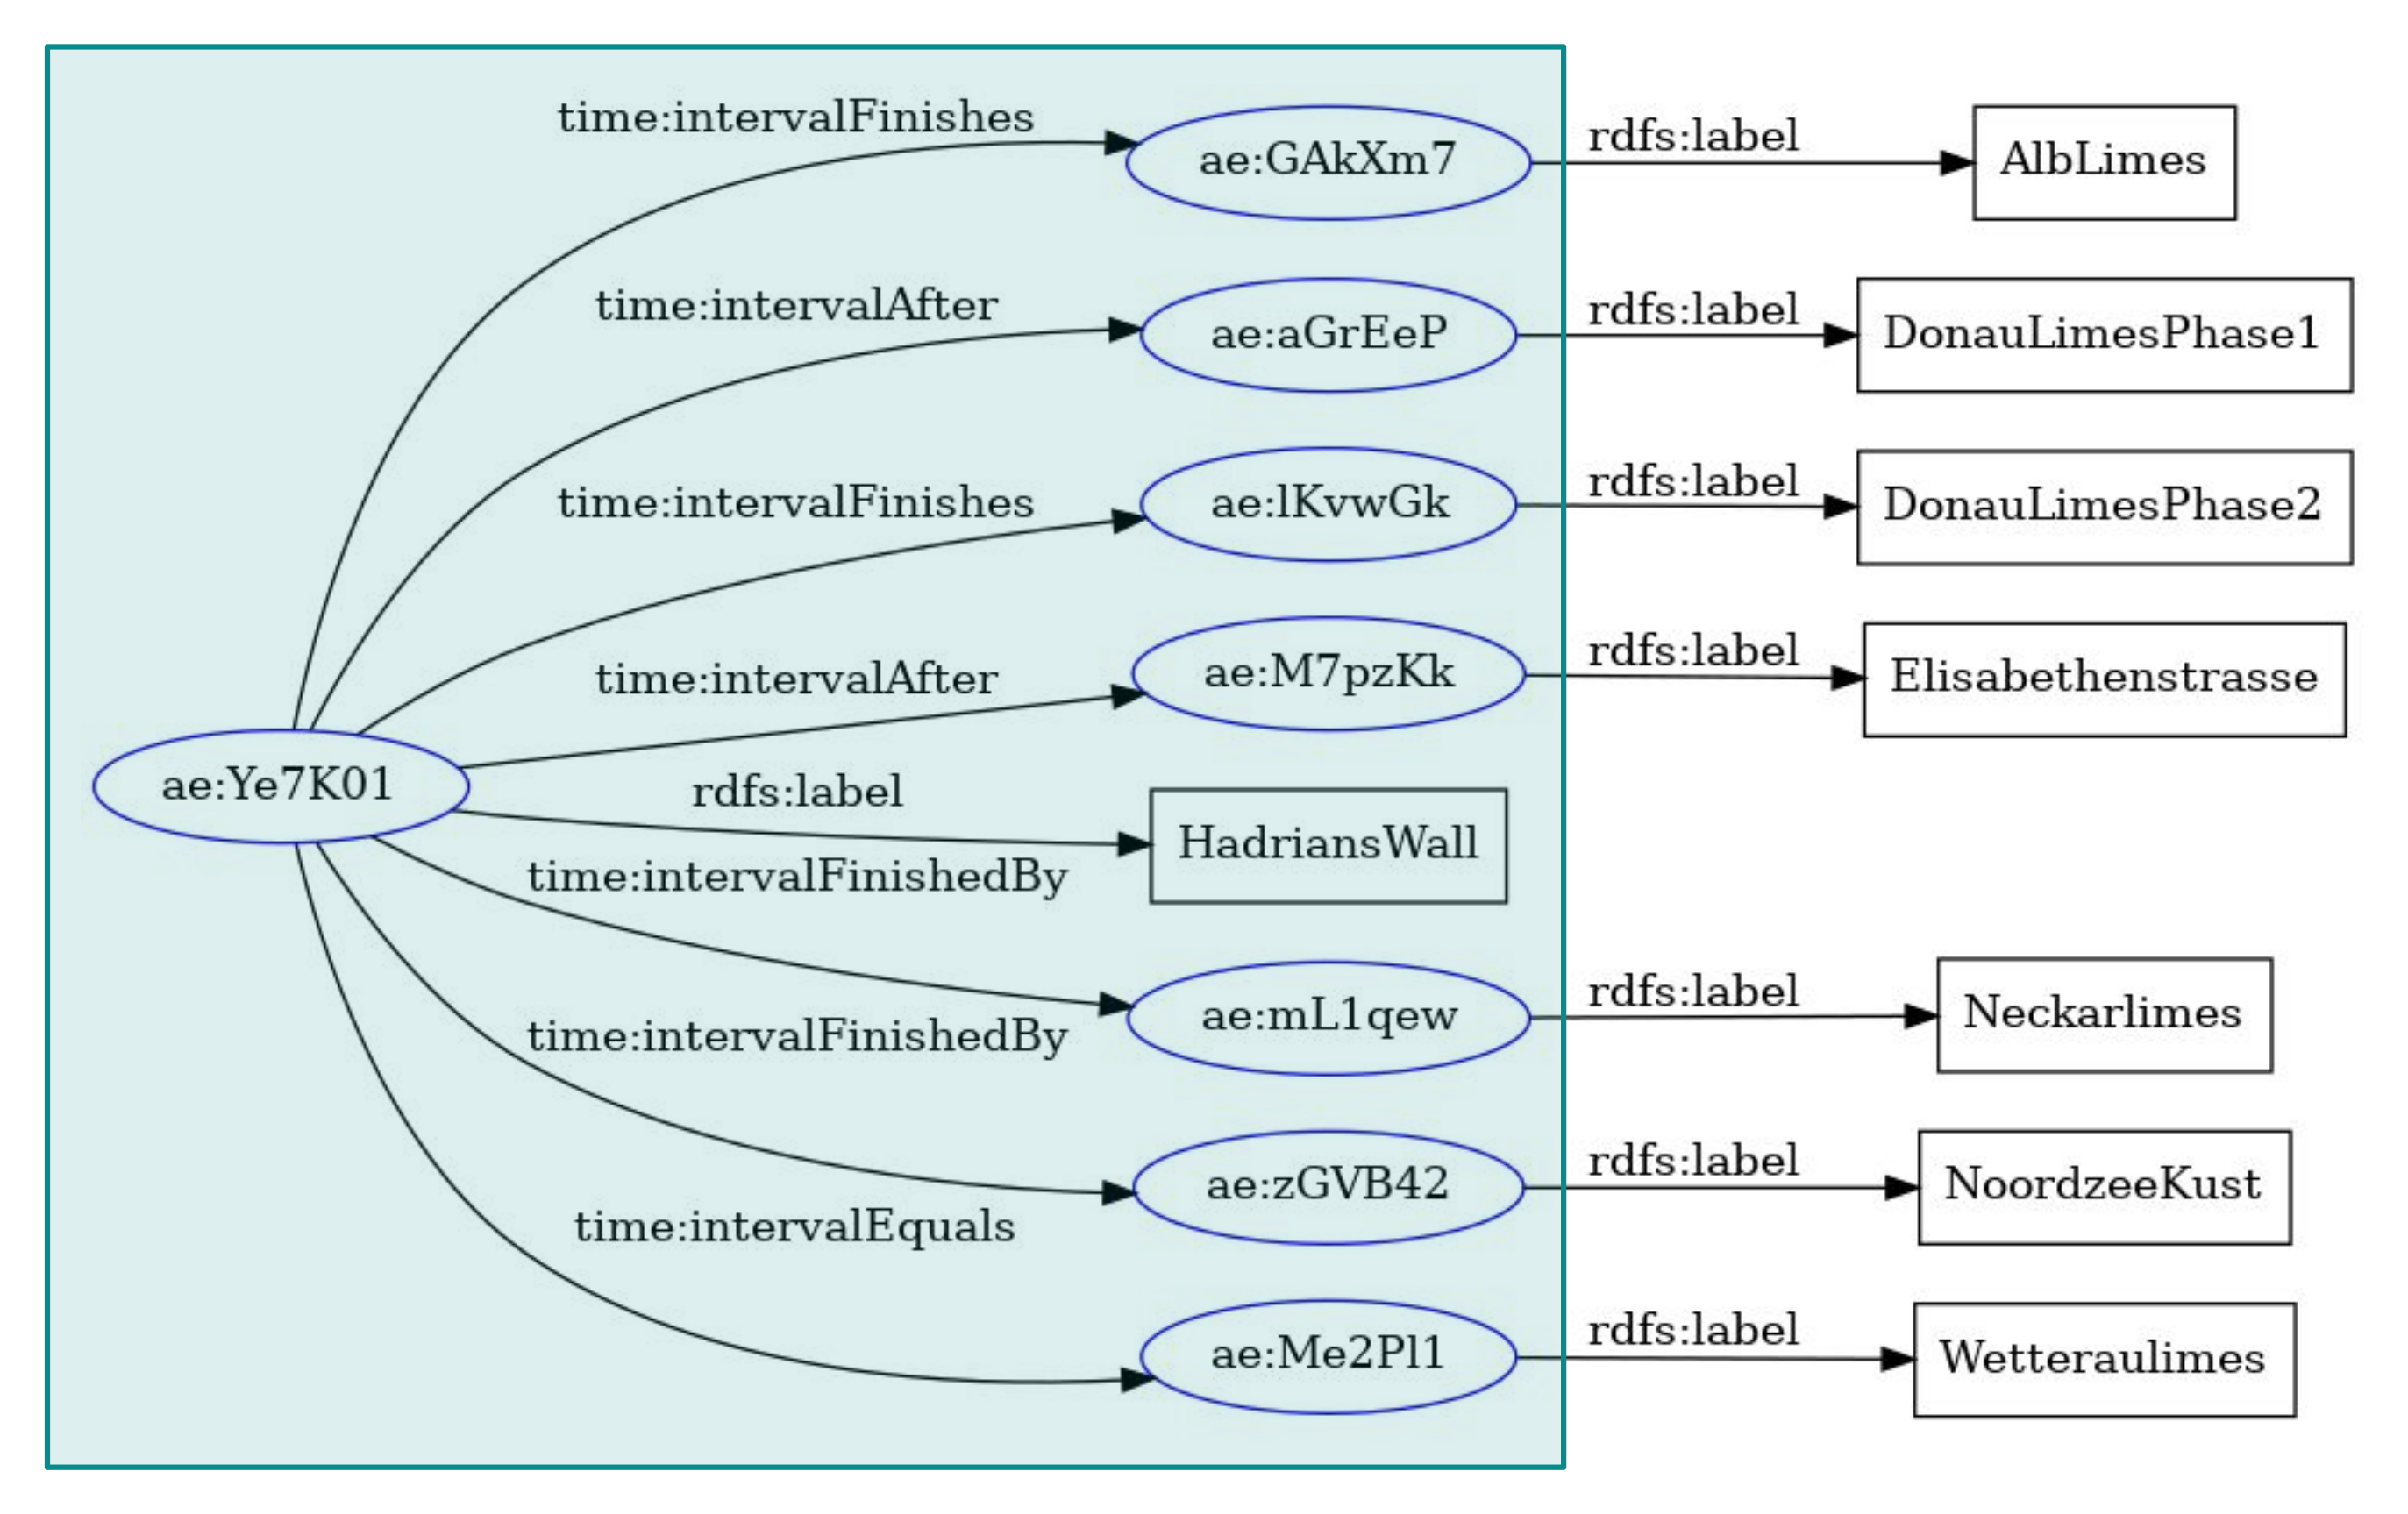
Hadrian’s Wall and the Allen Intervals as RDF, created with https://www.ldf.fi/service/rdf-grapher. Graphic: Florian Thiery CC BY 4.0
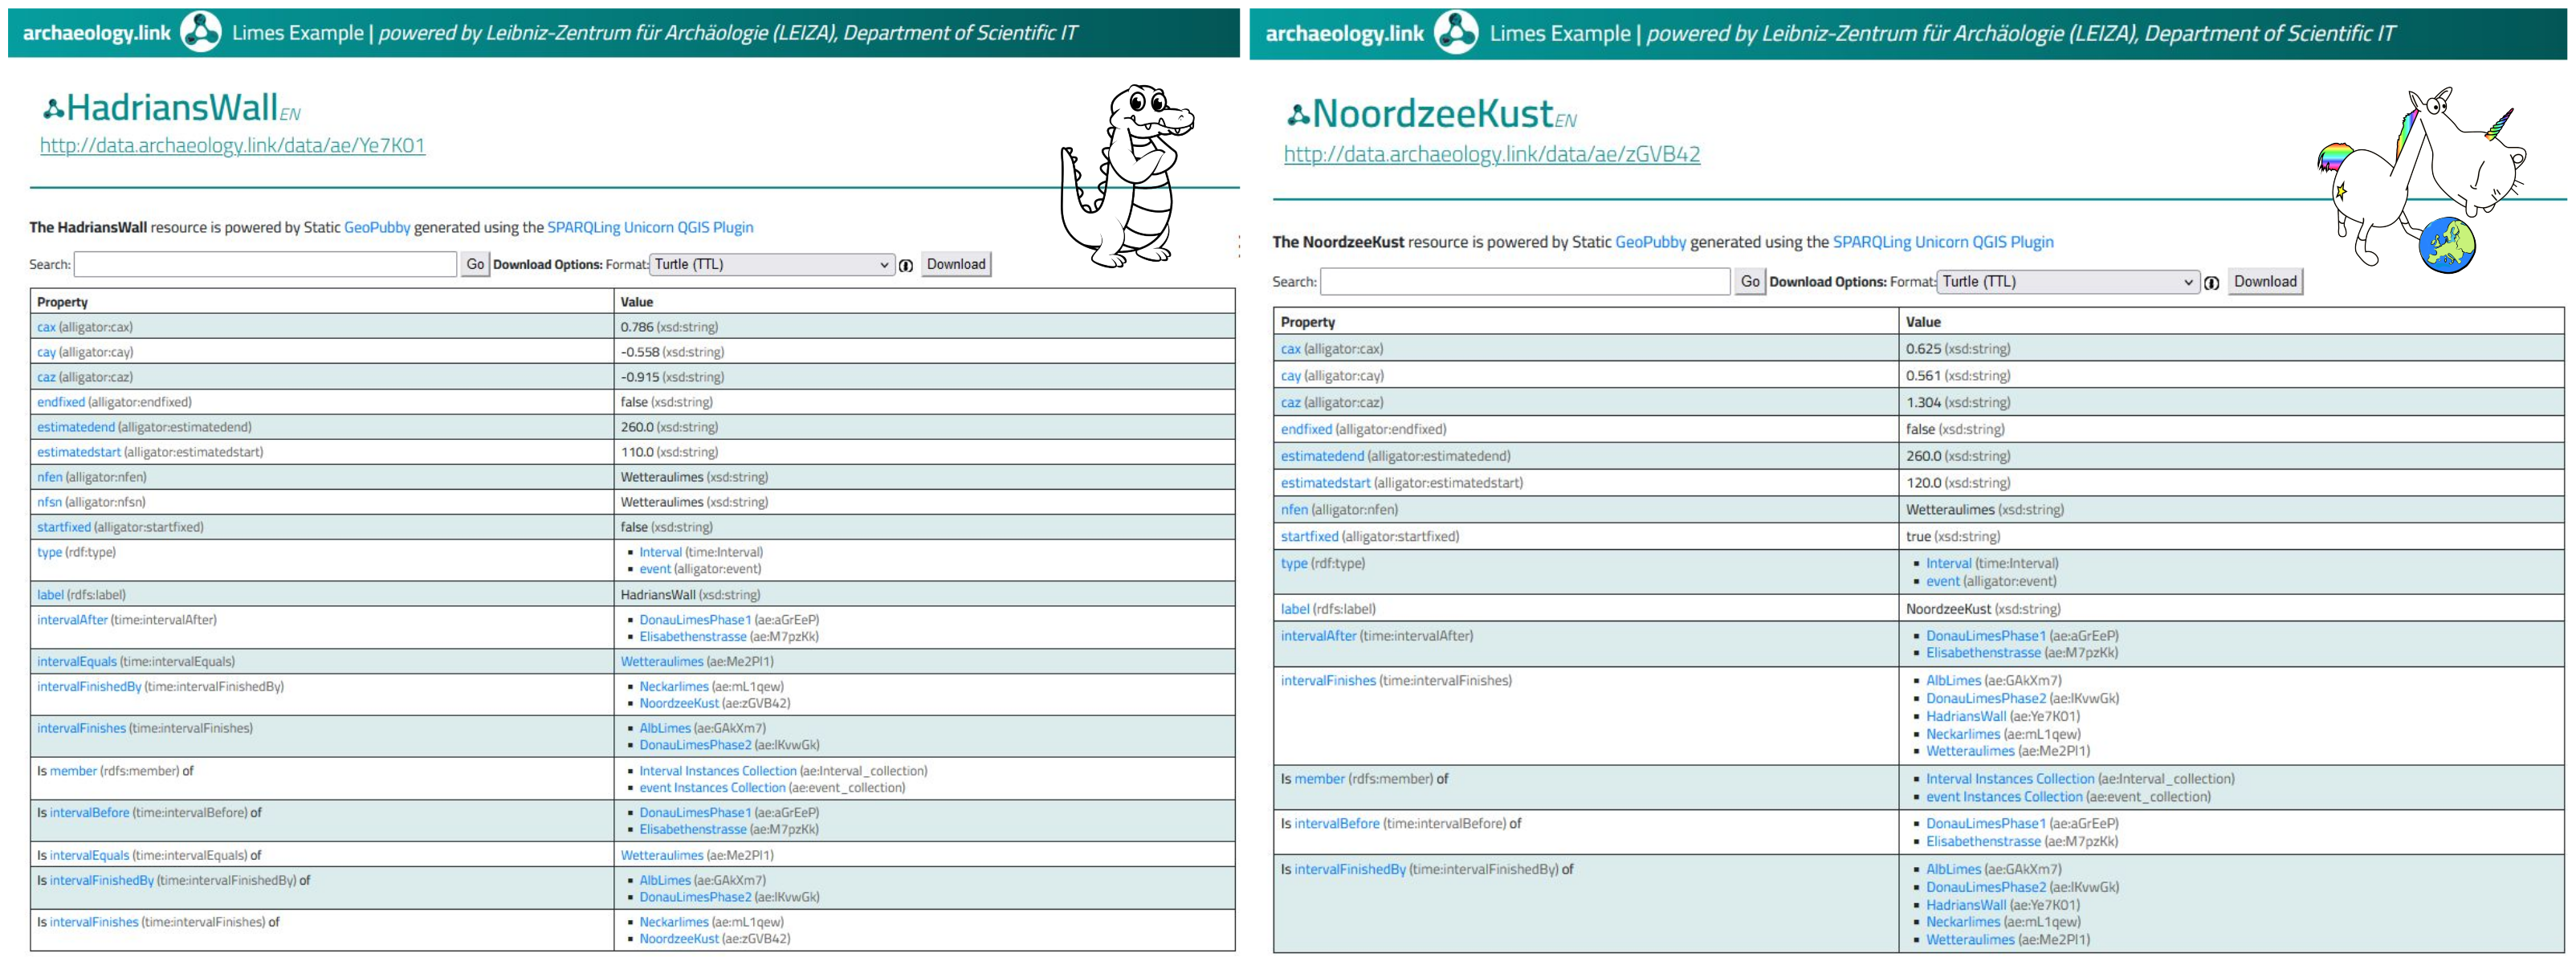
The Hadrian’s Wall (left) and North Sea Coast site TiGeR-results as LOD HTML Page, created with the SPARQL Unicorn Ontology Documentation tool as an HTML Page generator in GitHub Actions. Graphic: Florian Thiery CC BY 4.0
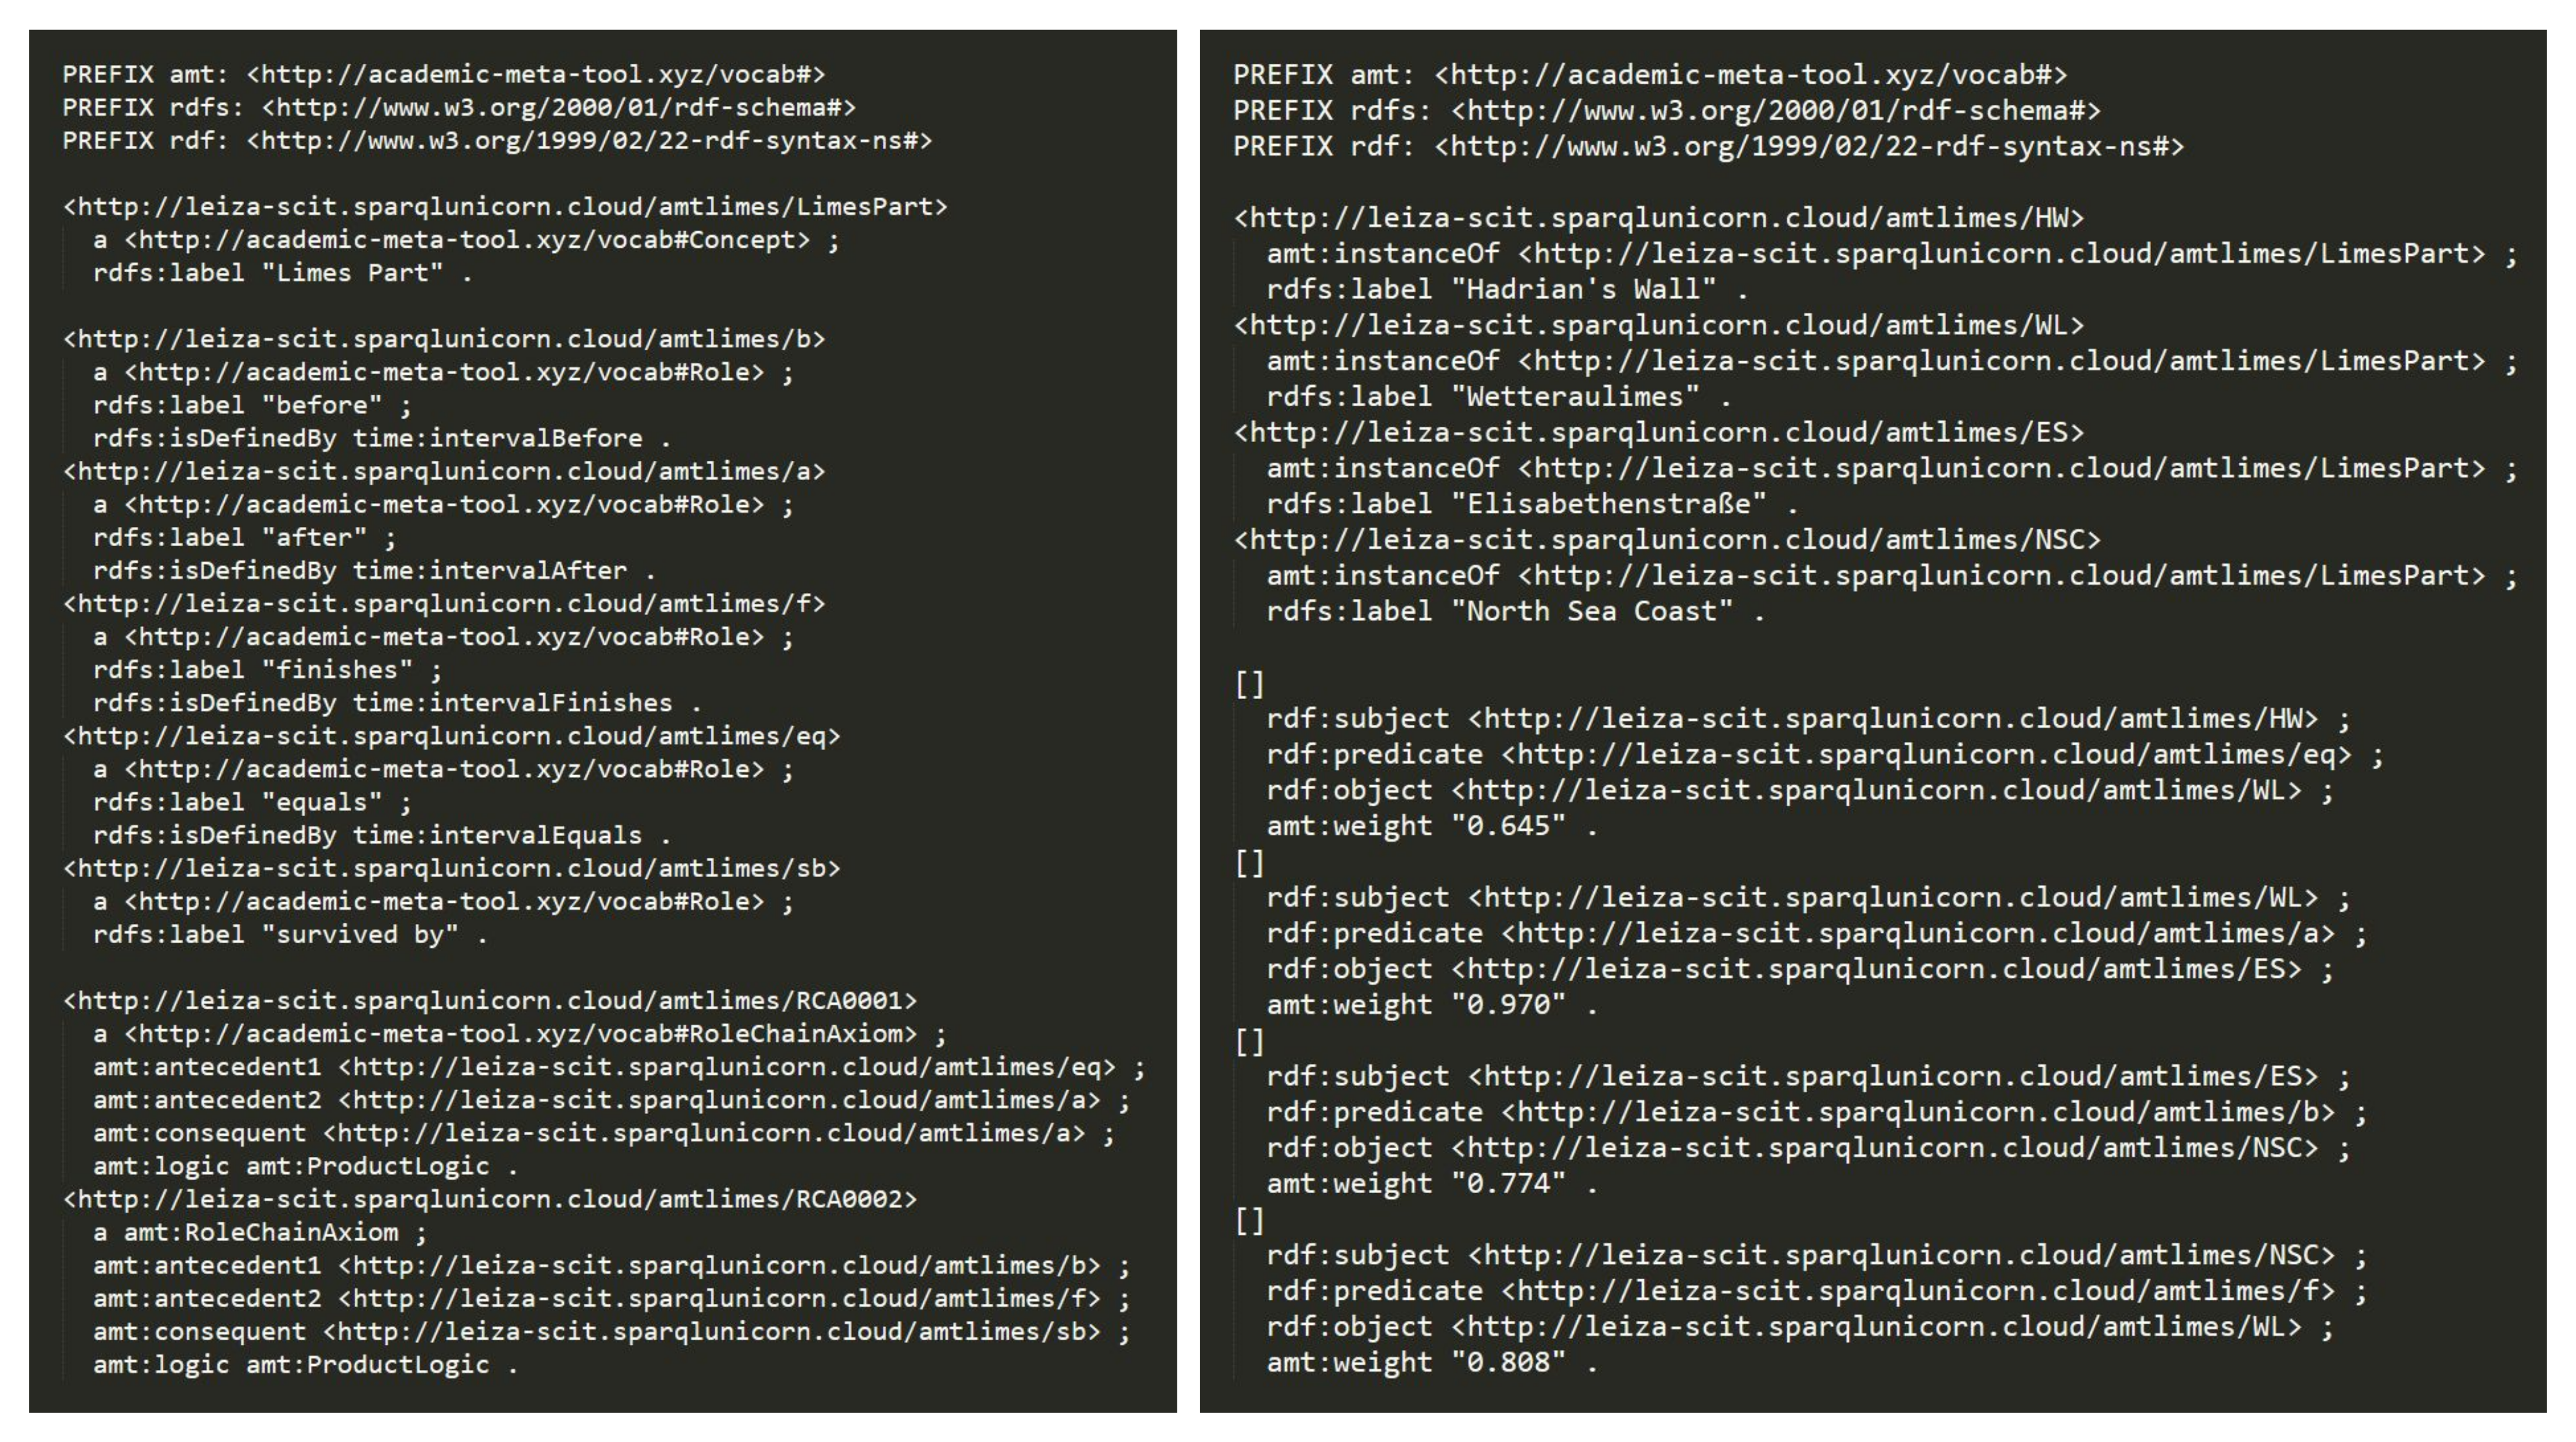
AMT statements for the Limes Example . Graphic: Florian Thiery CC BY 4.0
Paper Figures
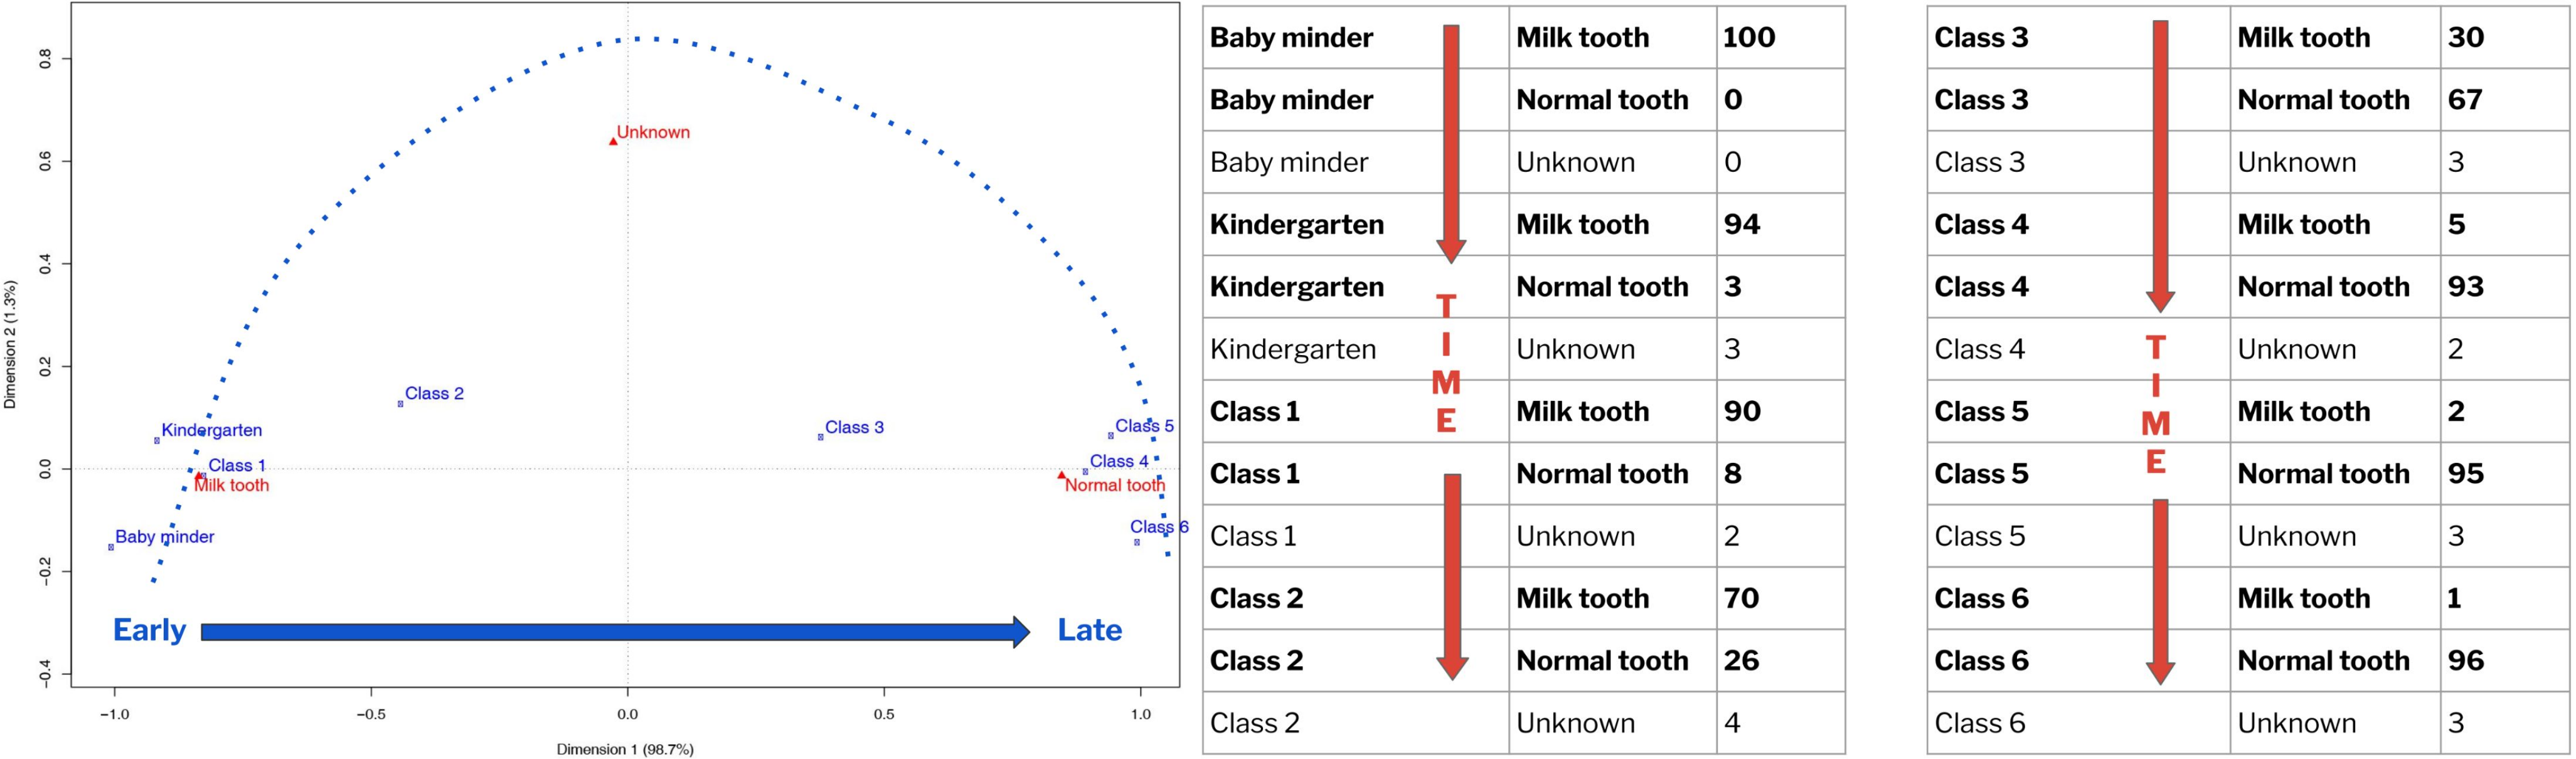
Fig. 1 Left: Temporal development of Milk/Normal teeth. The output of a CA of children’s secondary dentition showing a horseshoe parabola. Right: Temporal development of Milk/Normal teeth. Graphics: Allard W. Mees, CC BY 4.0
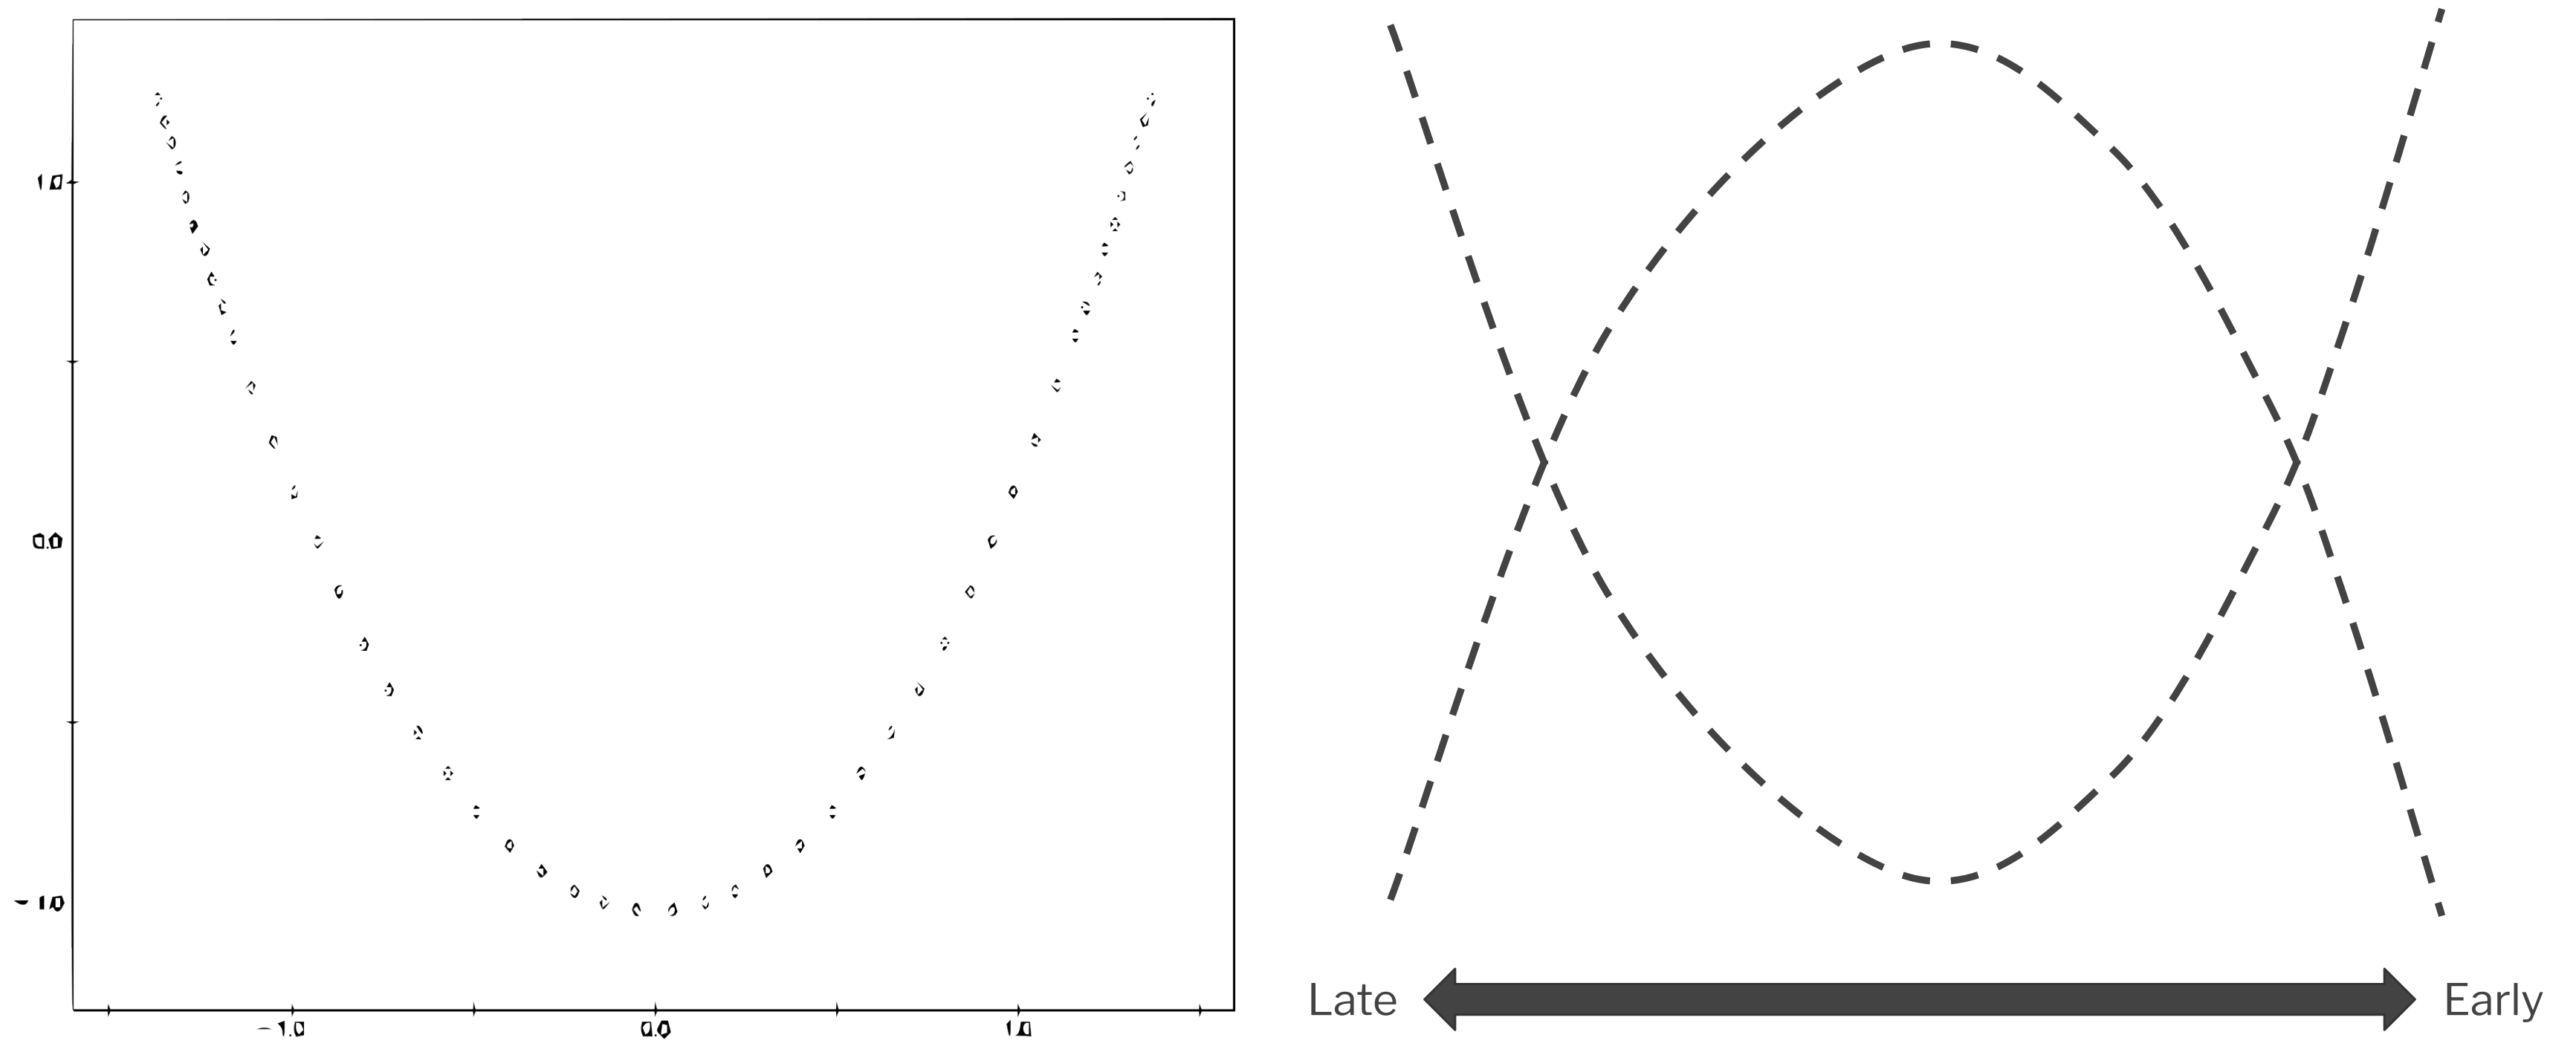
Fig. 2 Horseshoe paradigm, after Madsen (1988) . Graphic: Allard W. Mees / Florian Thiery, CC BY 4.0
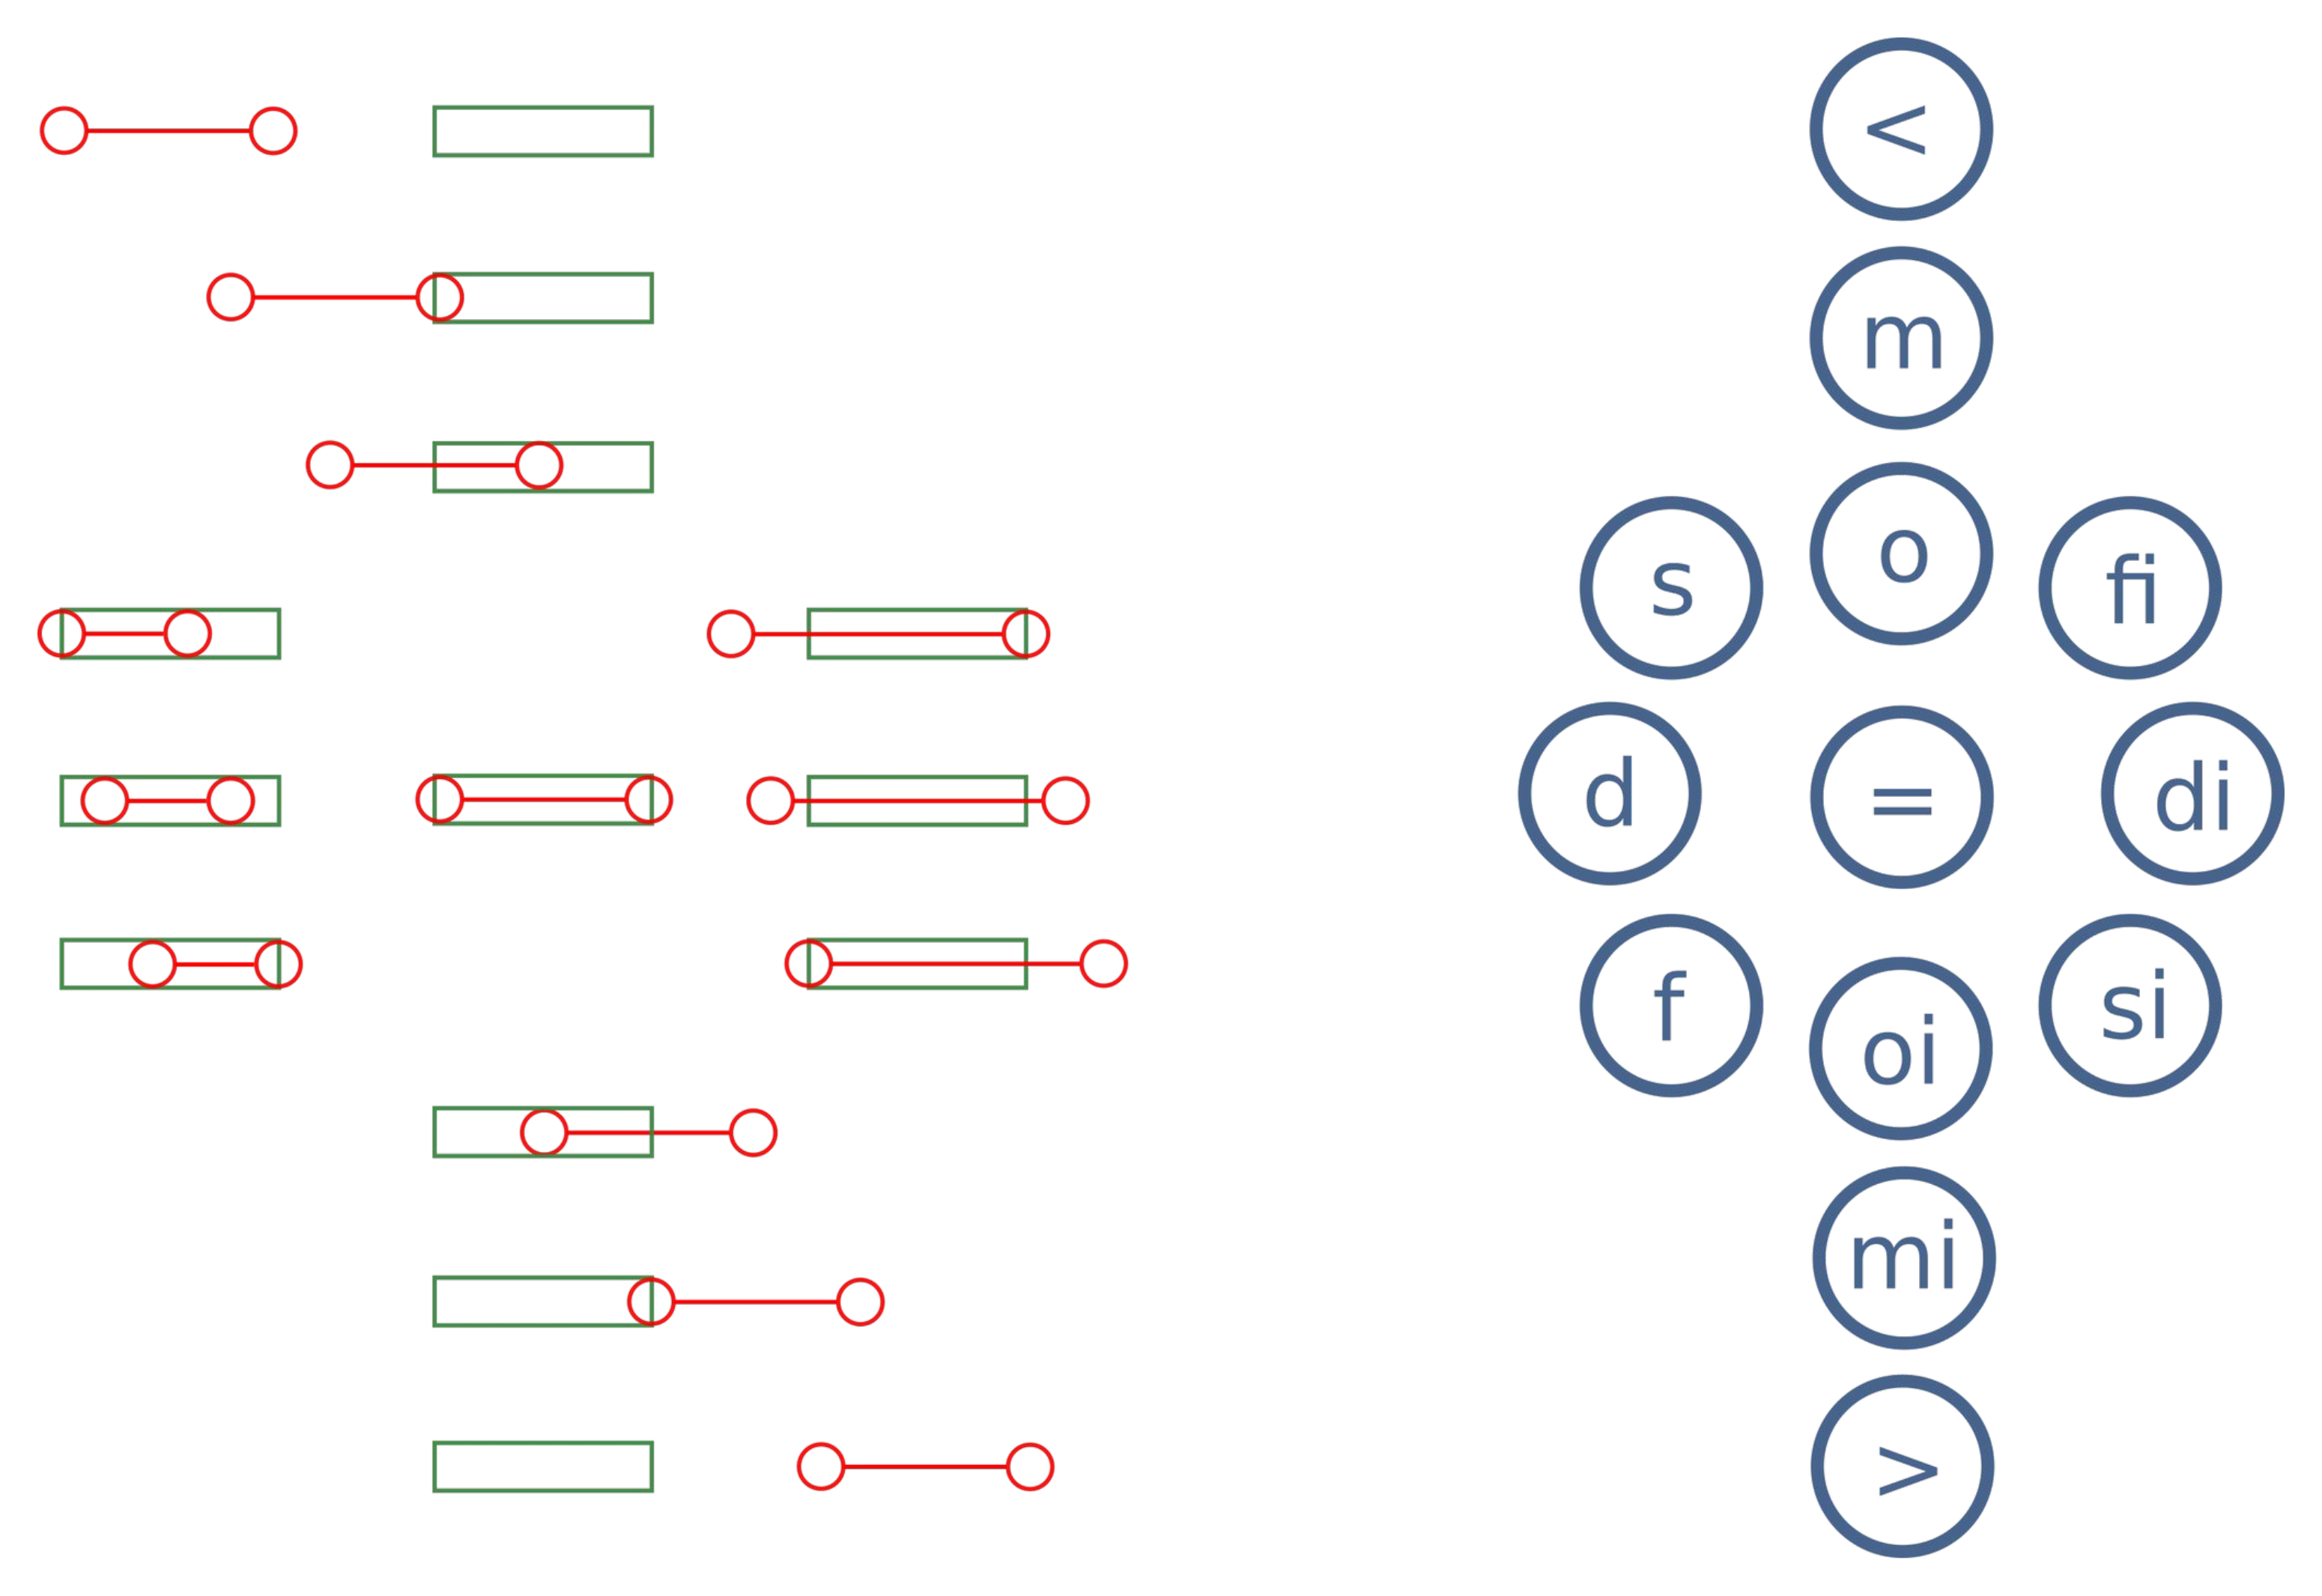
Fig. 3 Left: Temporal relations according to Allen’s interval algebra between two events (red: event A, green: event B; e.g., event A < (=before) event B) arranged according to their conceptual neighborhood. Right: The corresponding labels are arranged accordingly. After Freksa (1992, S. 14), Fig. 3 . Graphic: Florian Thiery CC BY 4.0, via Wikimedia Commons
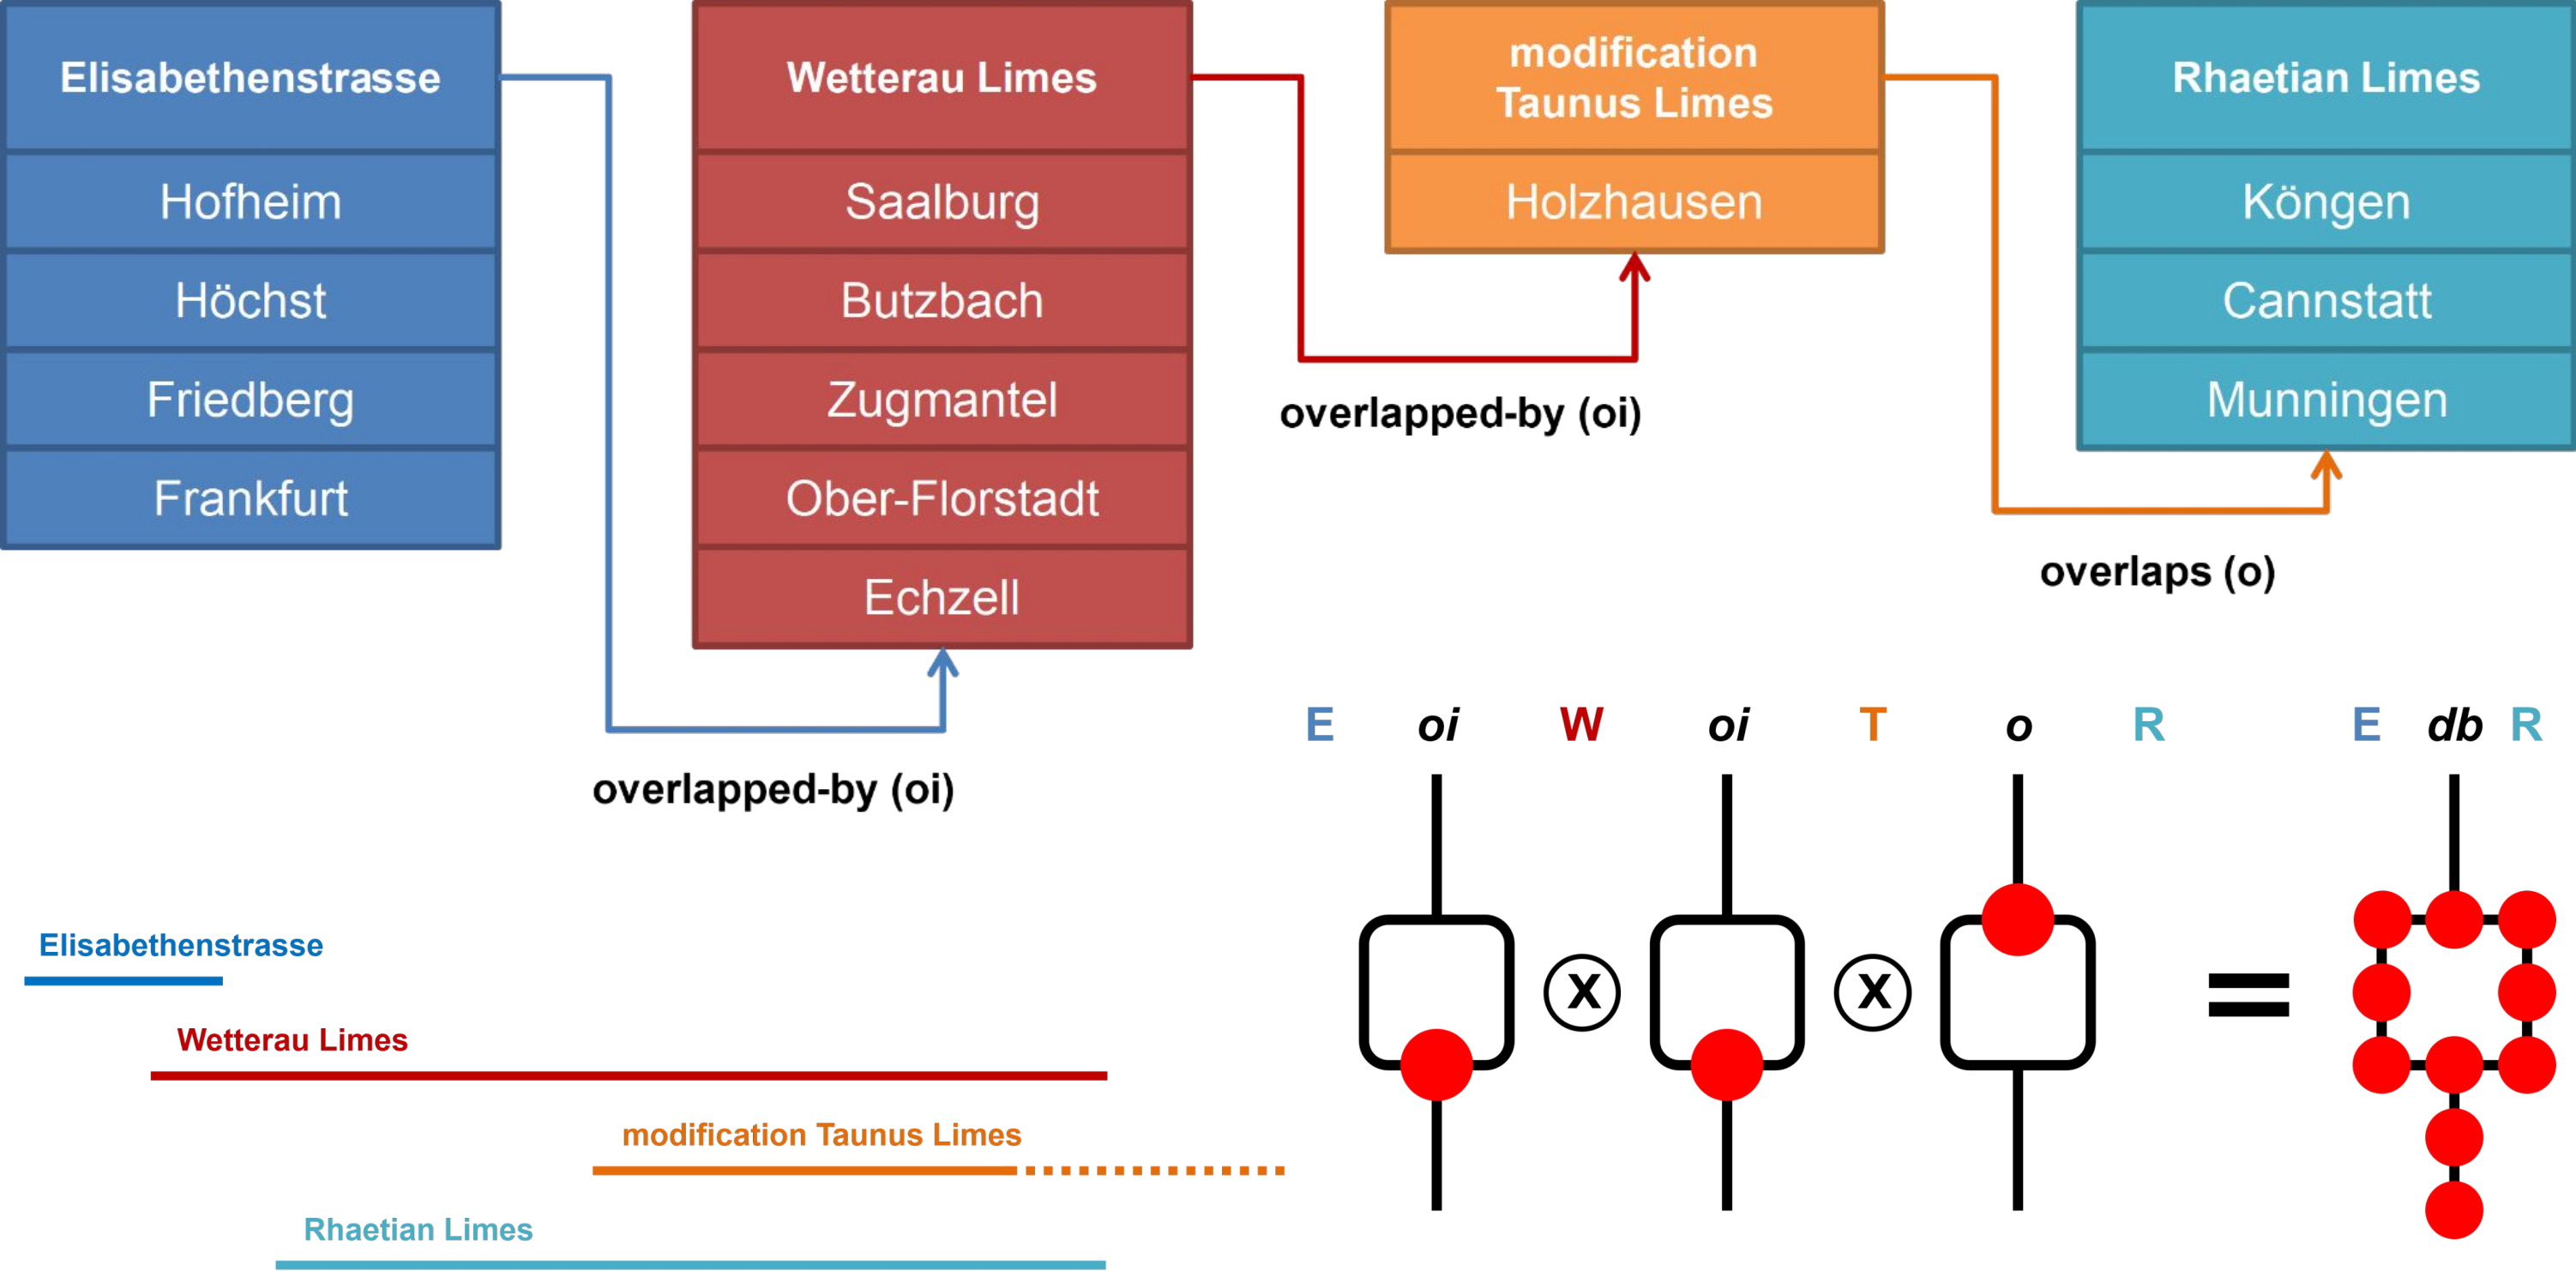
Fig. 4 Example of temporal reasoning using four Limes sections. Graphic: Florian Thiery, CC BY 4.0
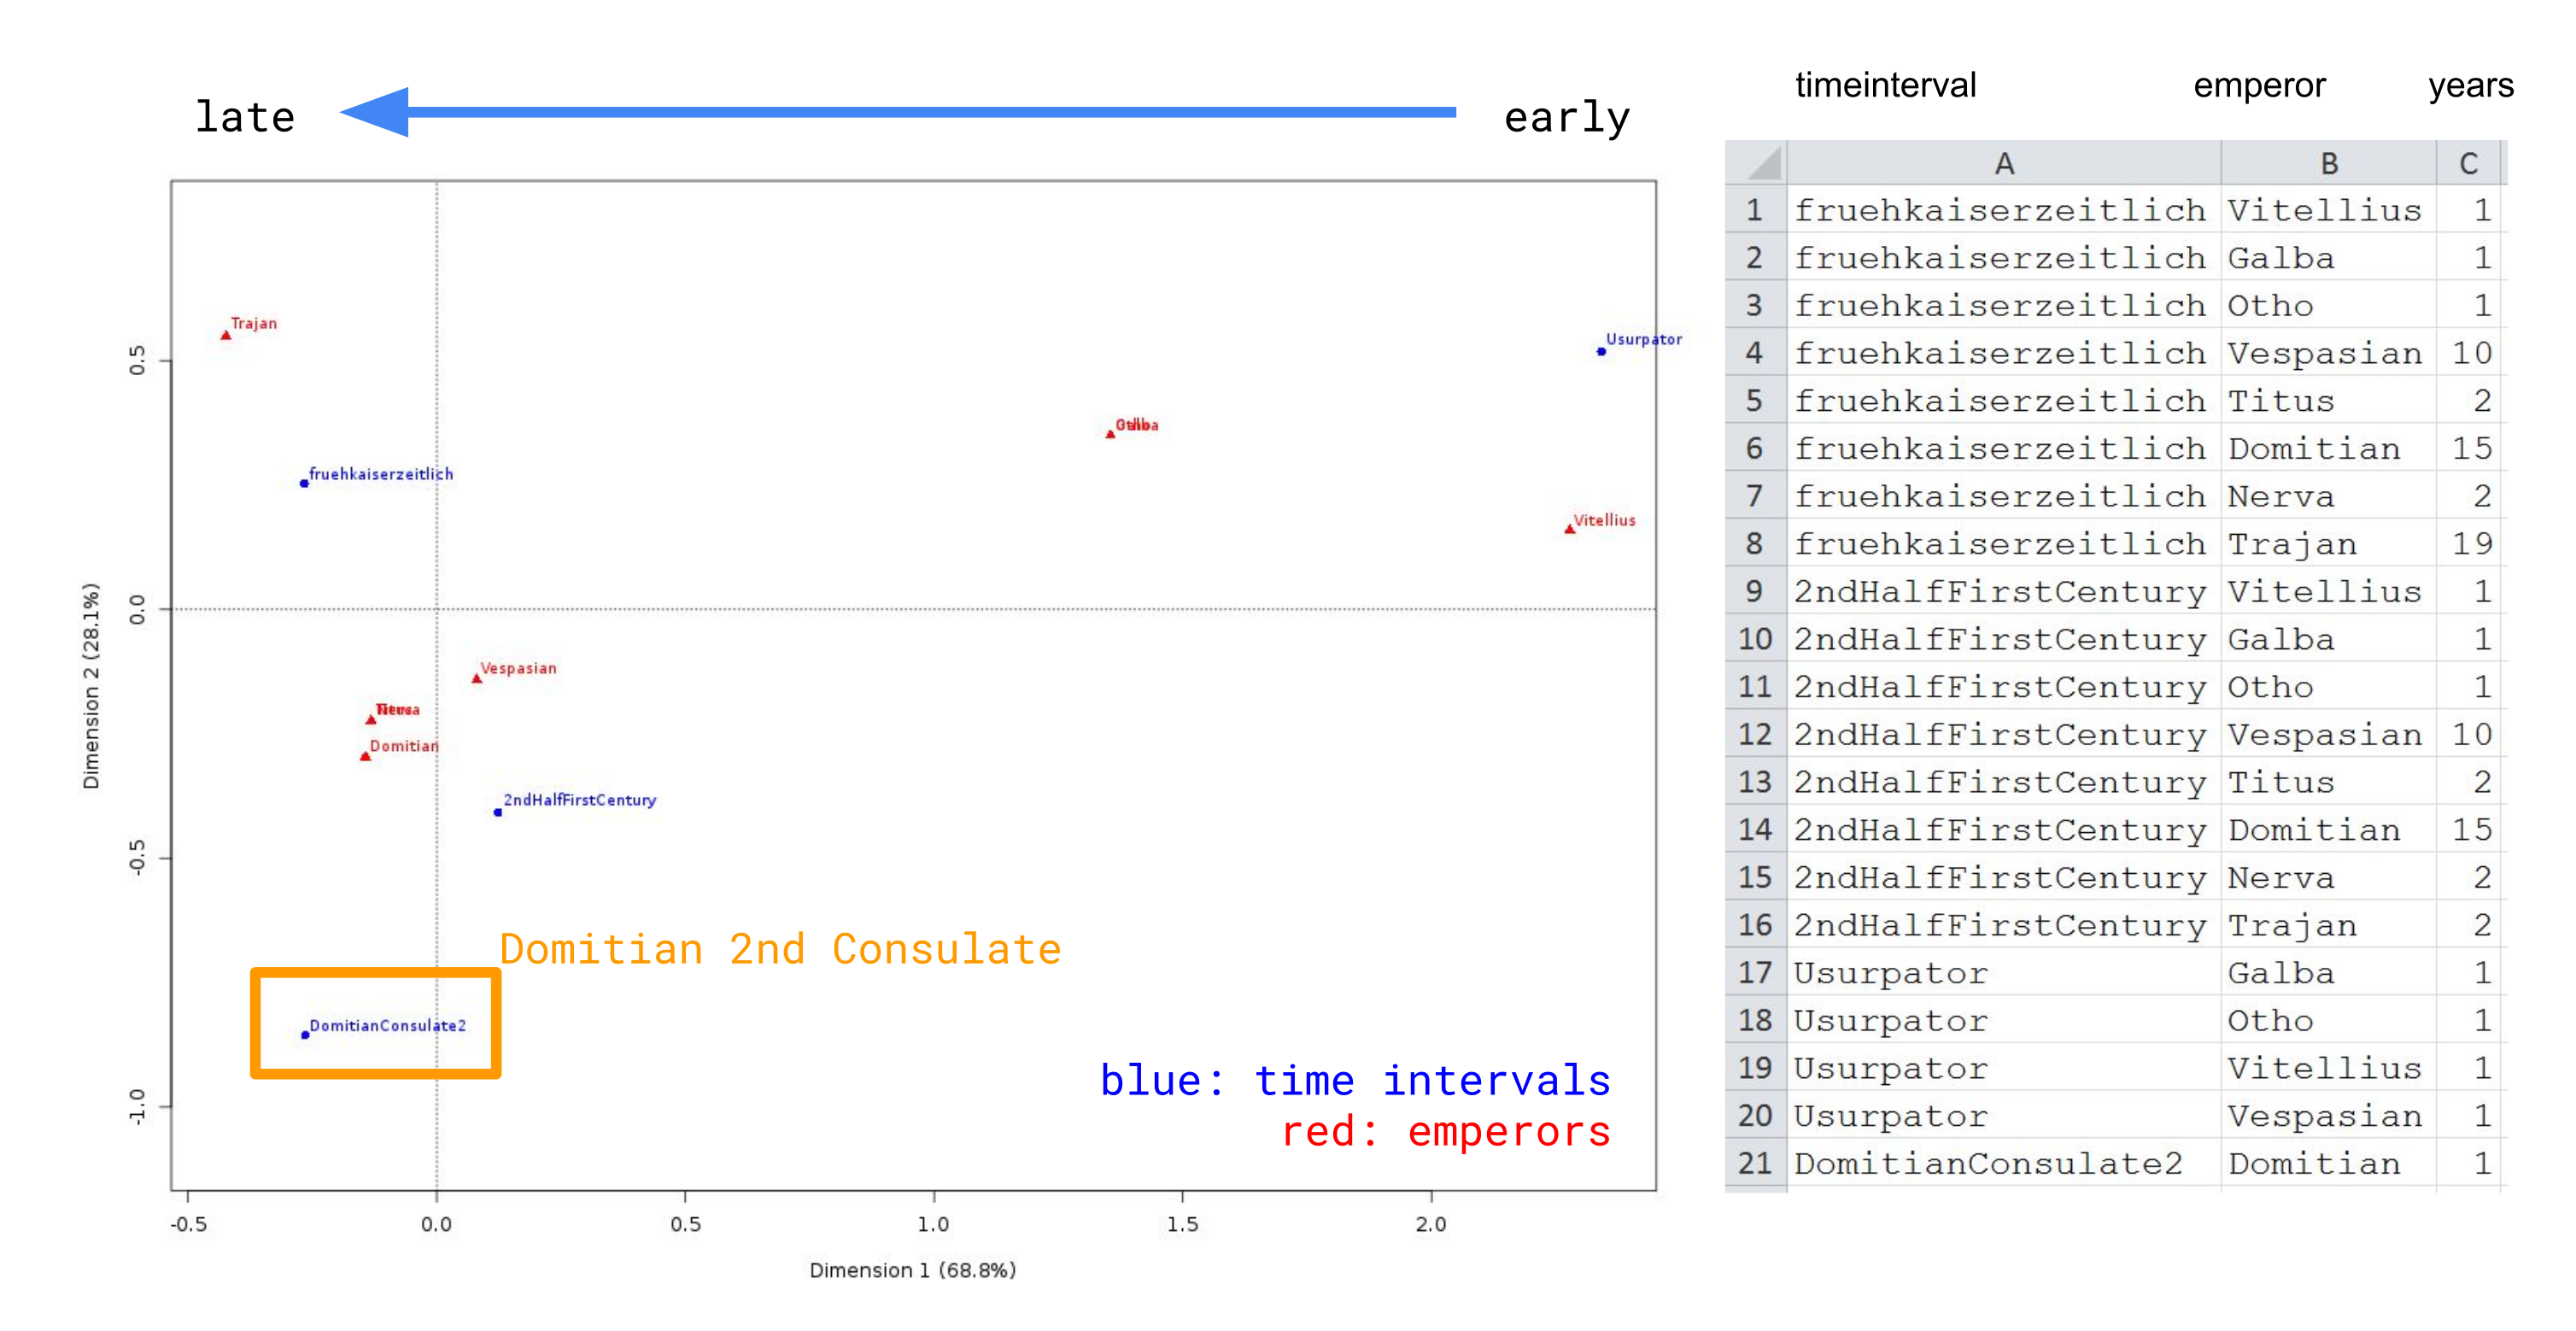
Fig. 5 Alligator method test Roman emperors, correspondence analysis, via DOI: 10.5281/zenodo.1410516. Graphic: Florian Thiery / Allard W. Mees, CC BY 4.0
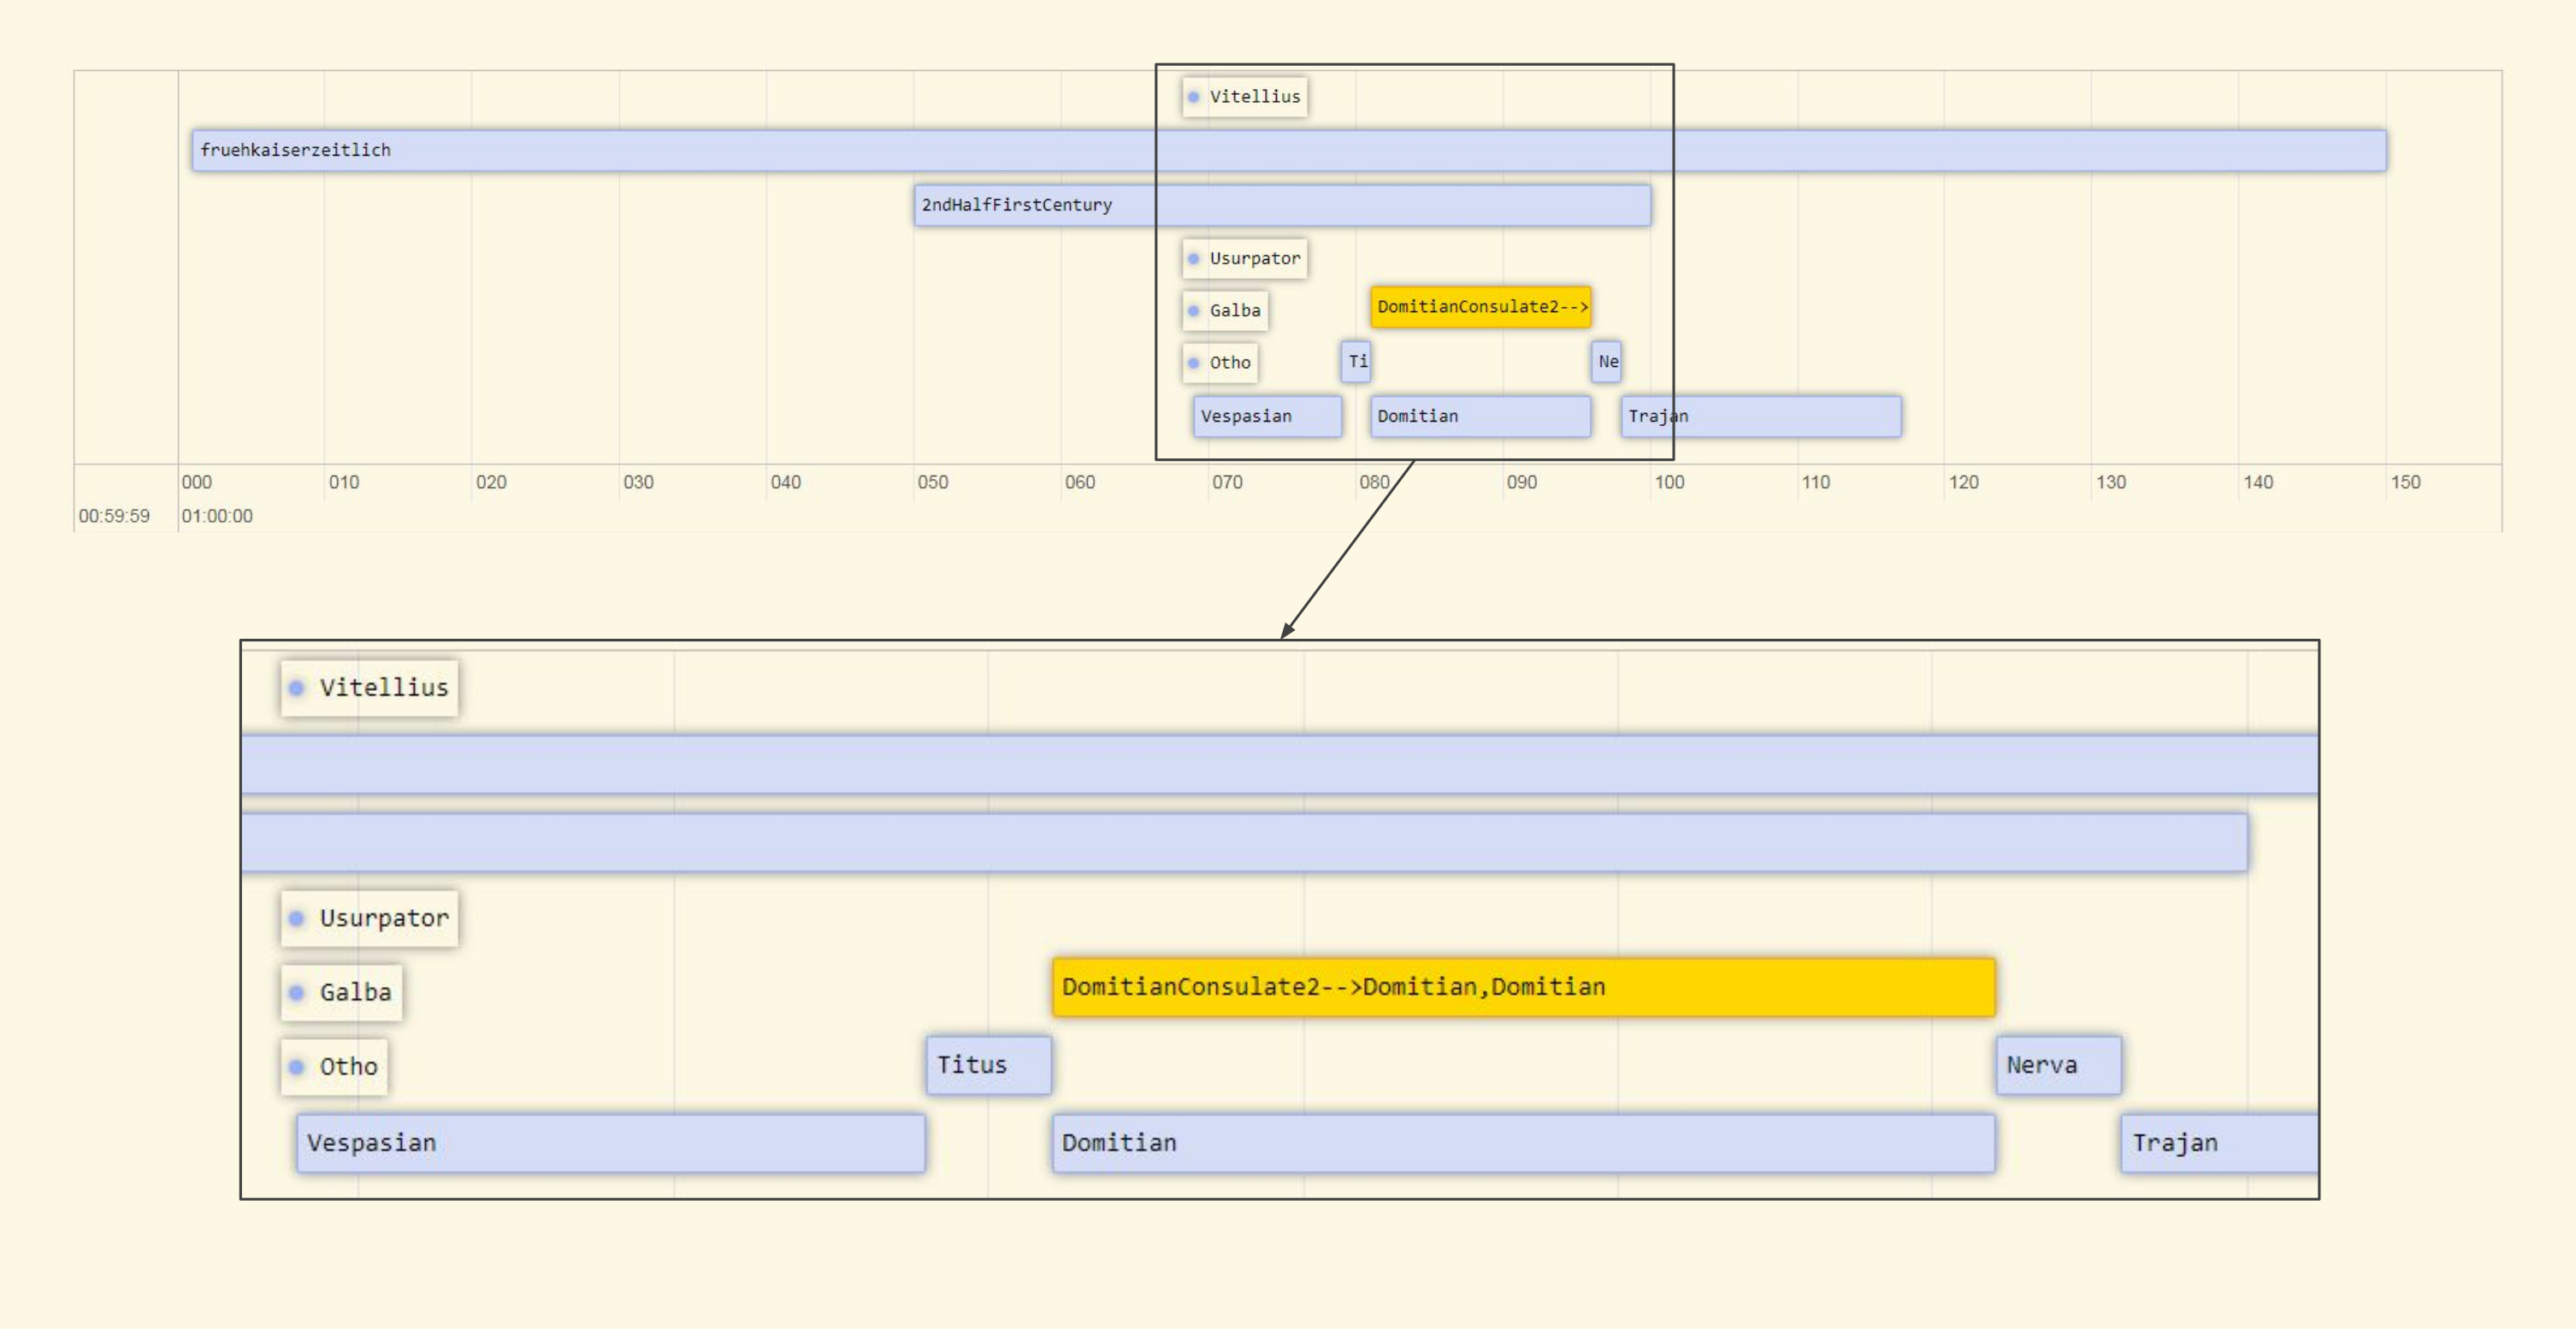
Fig. 6 Alligator method test Roman emperors, result as virtual timeline, via DOI: 10.5281/zenodo.1410516. Graphic: Florian Thiery / Allard W. Mees, CC BY 4.0
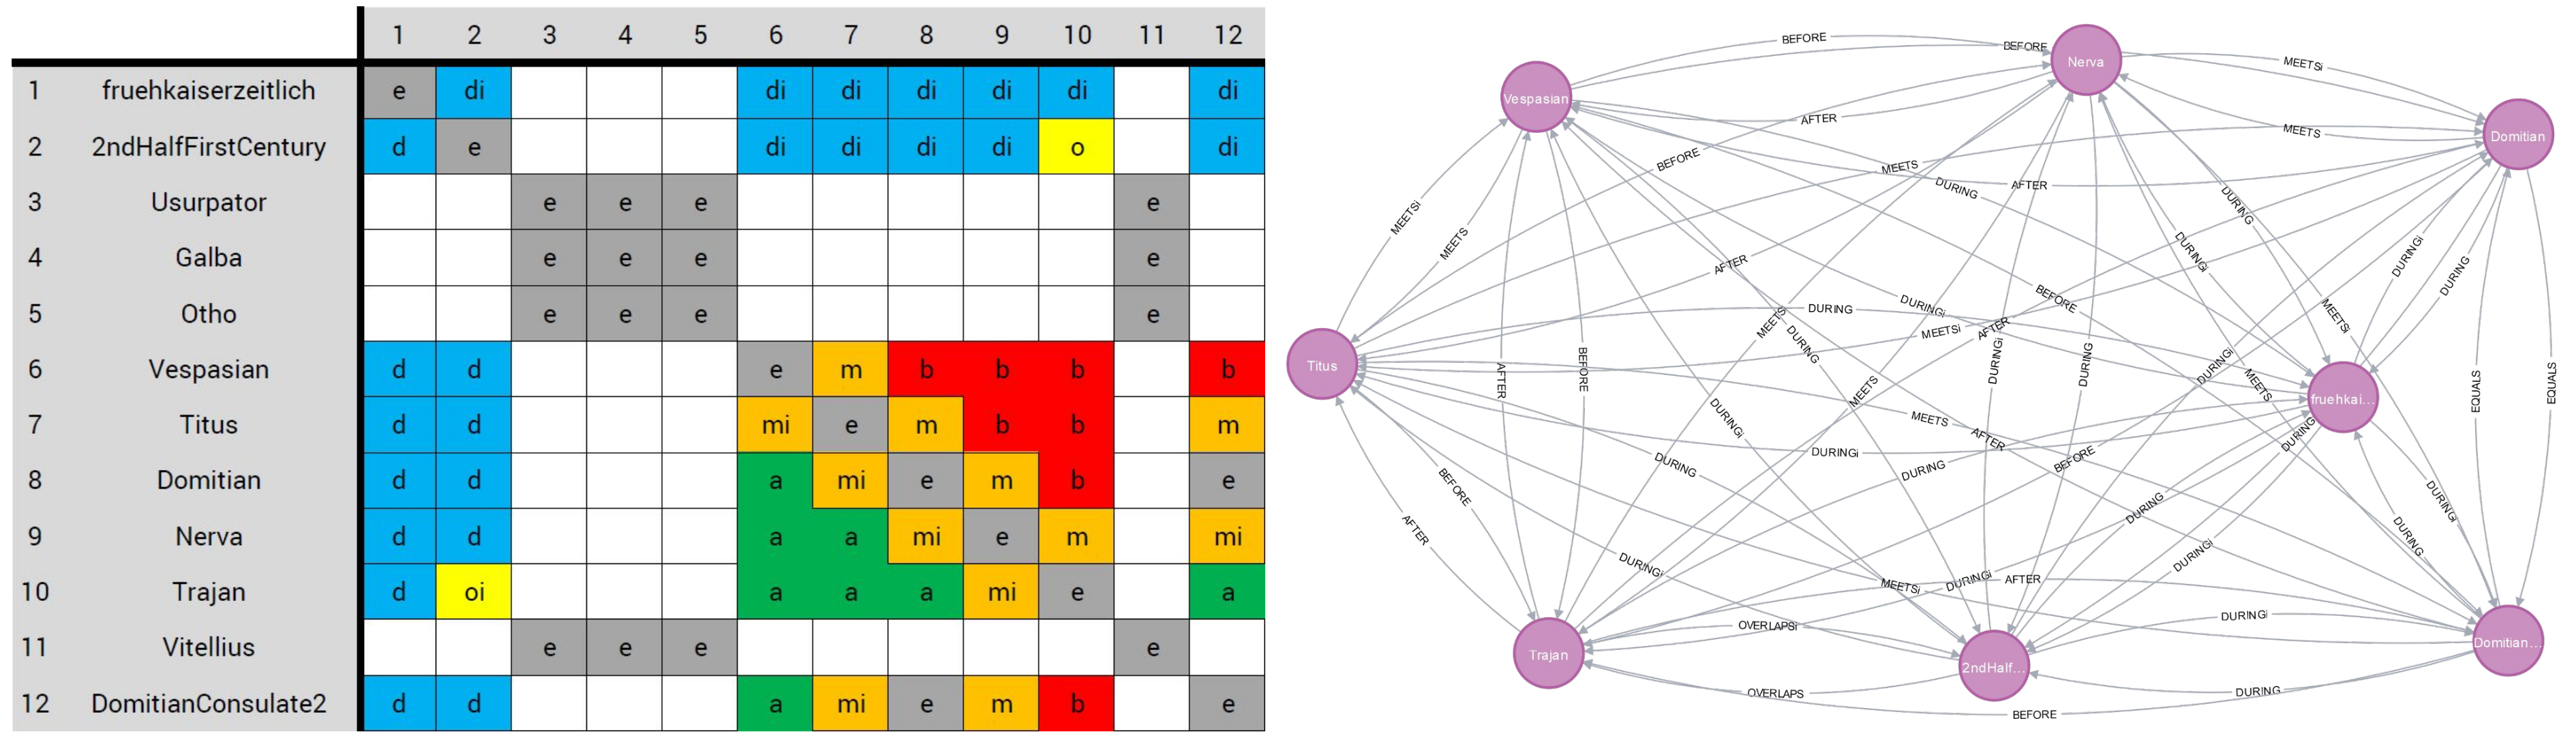
Fig. 7 Alligator method test Roman emperors, result as relative chronology, via DOI: 10.5281/zenodo.1410516. Graphic: Florian Thiery / Allard W. Mees, CC BY 4.0
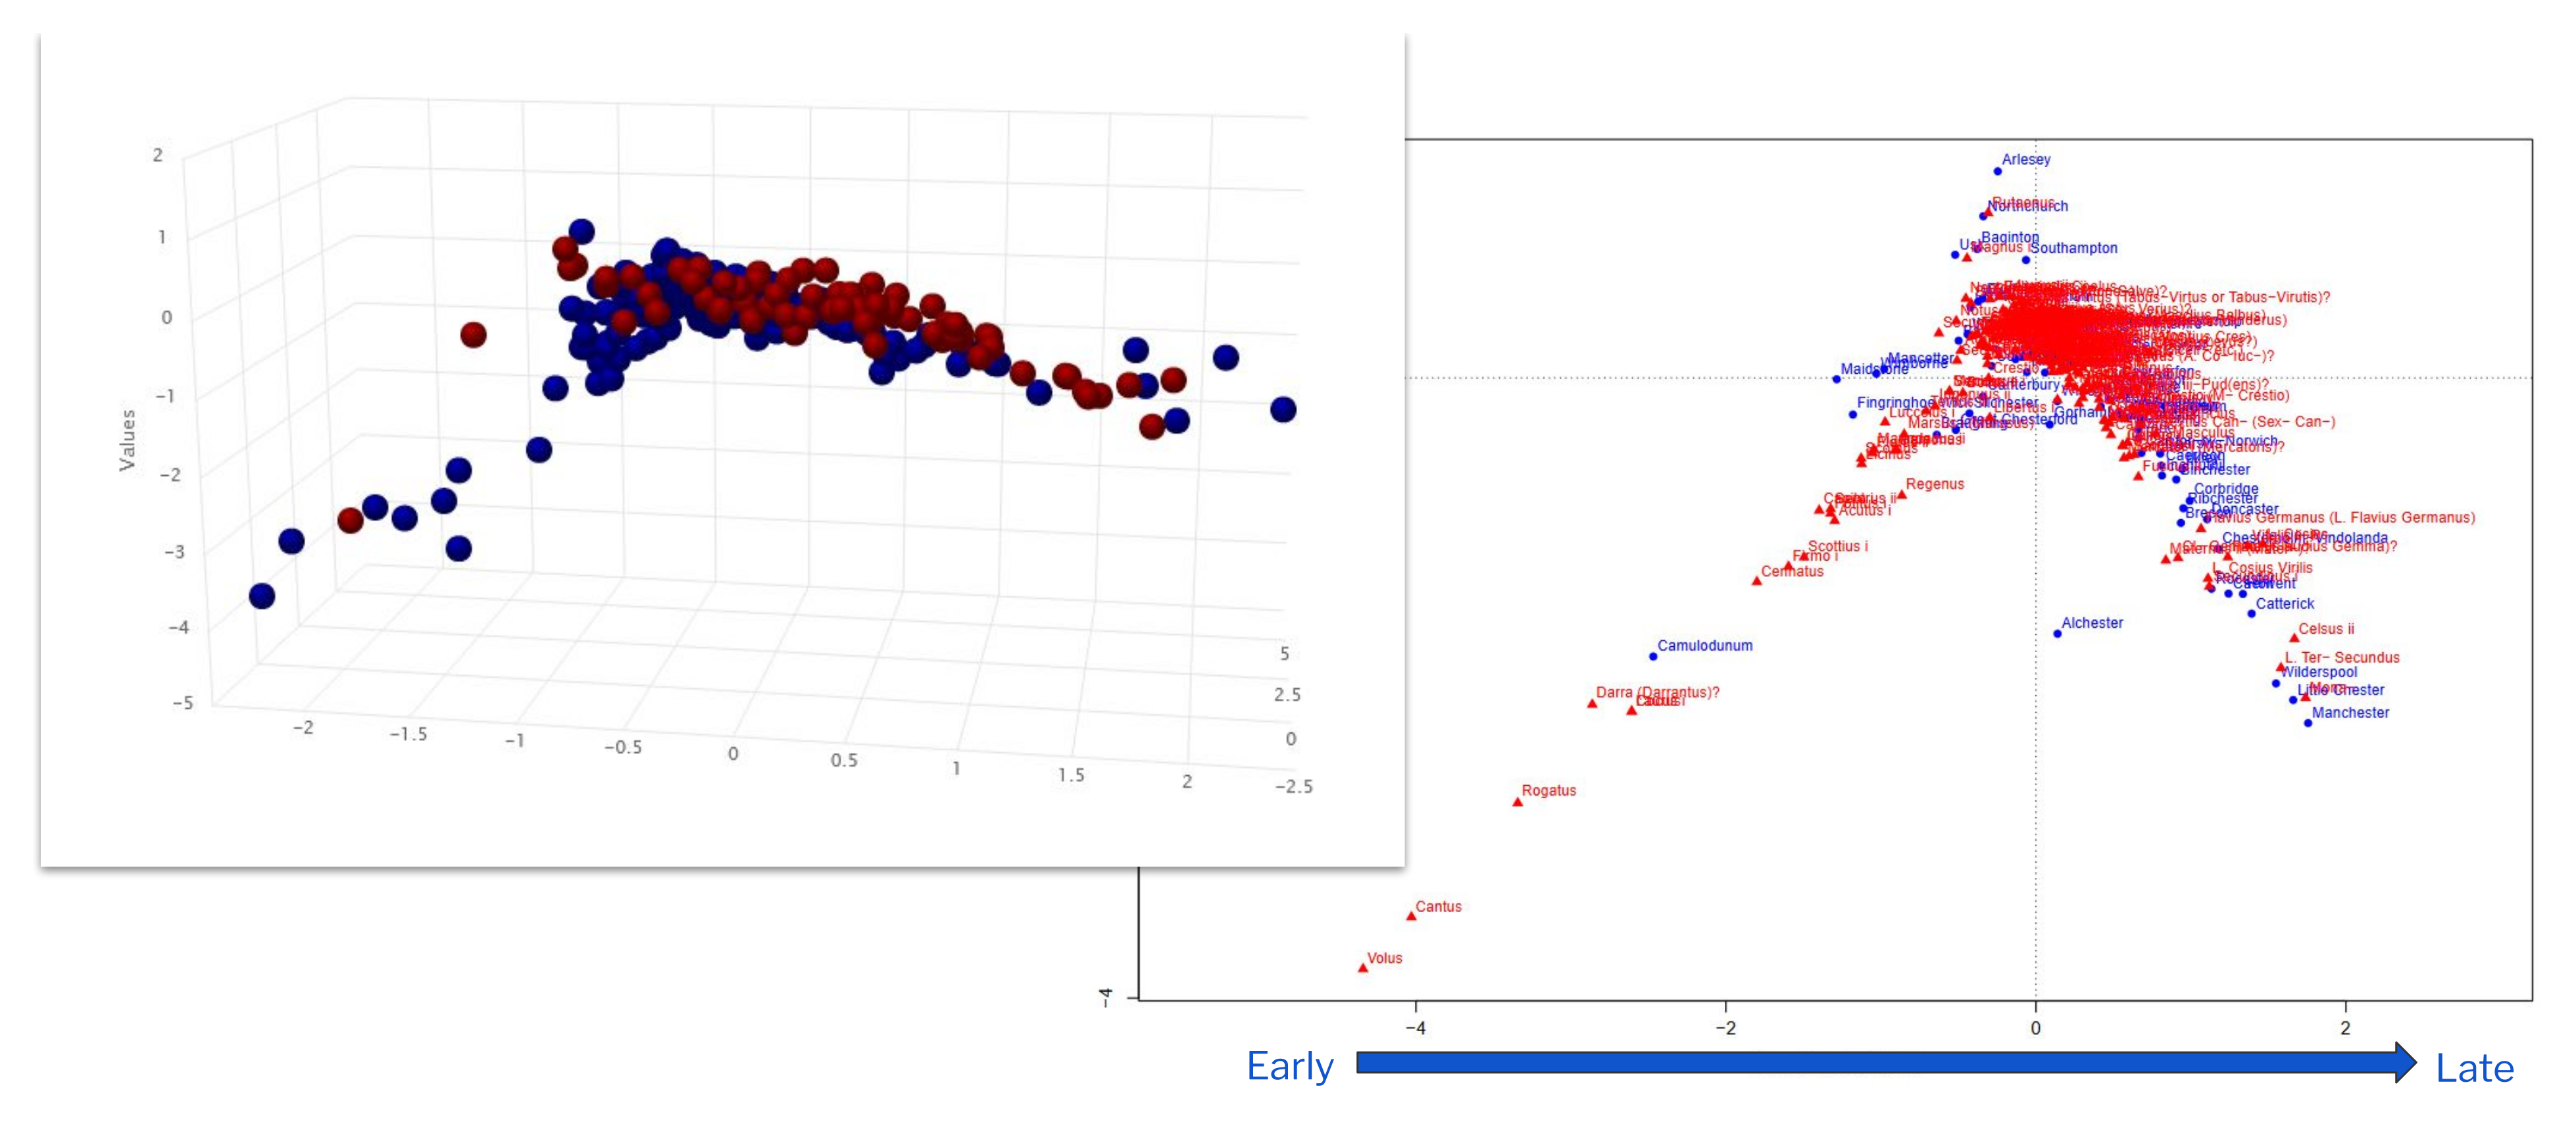
Fig. 8 Dated sites in Britannia in a CA. Graphic: Allard W. Mees, CC BY 4.0
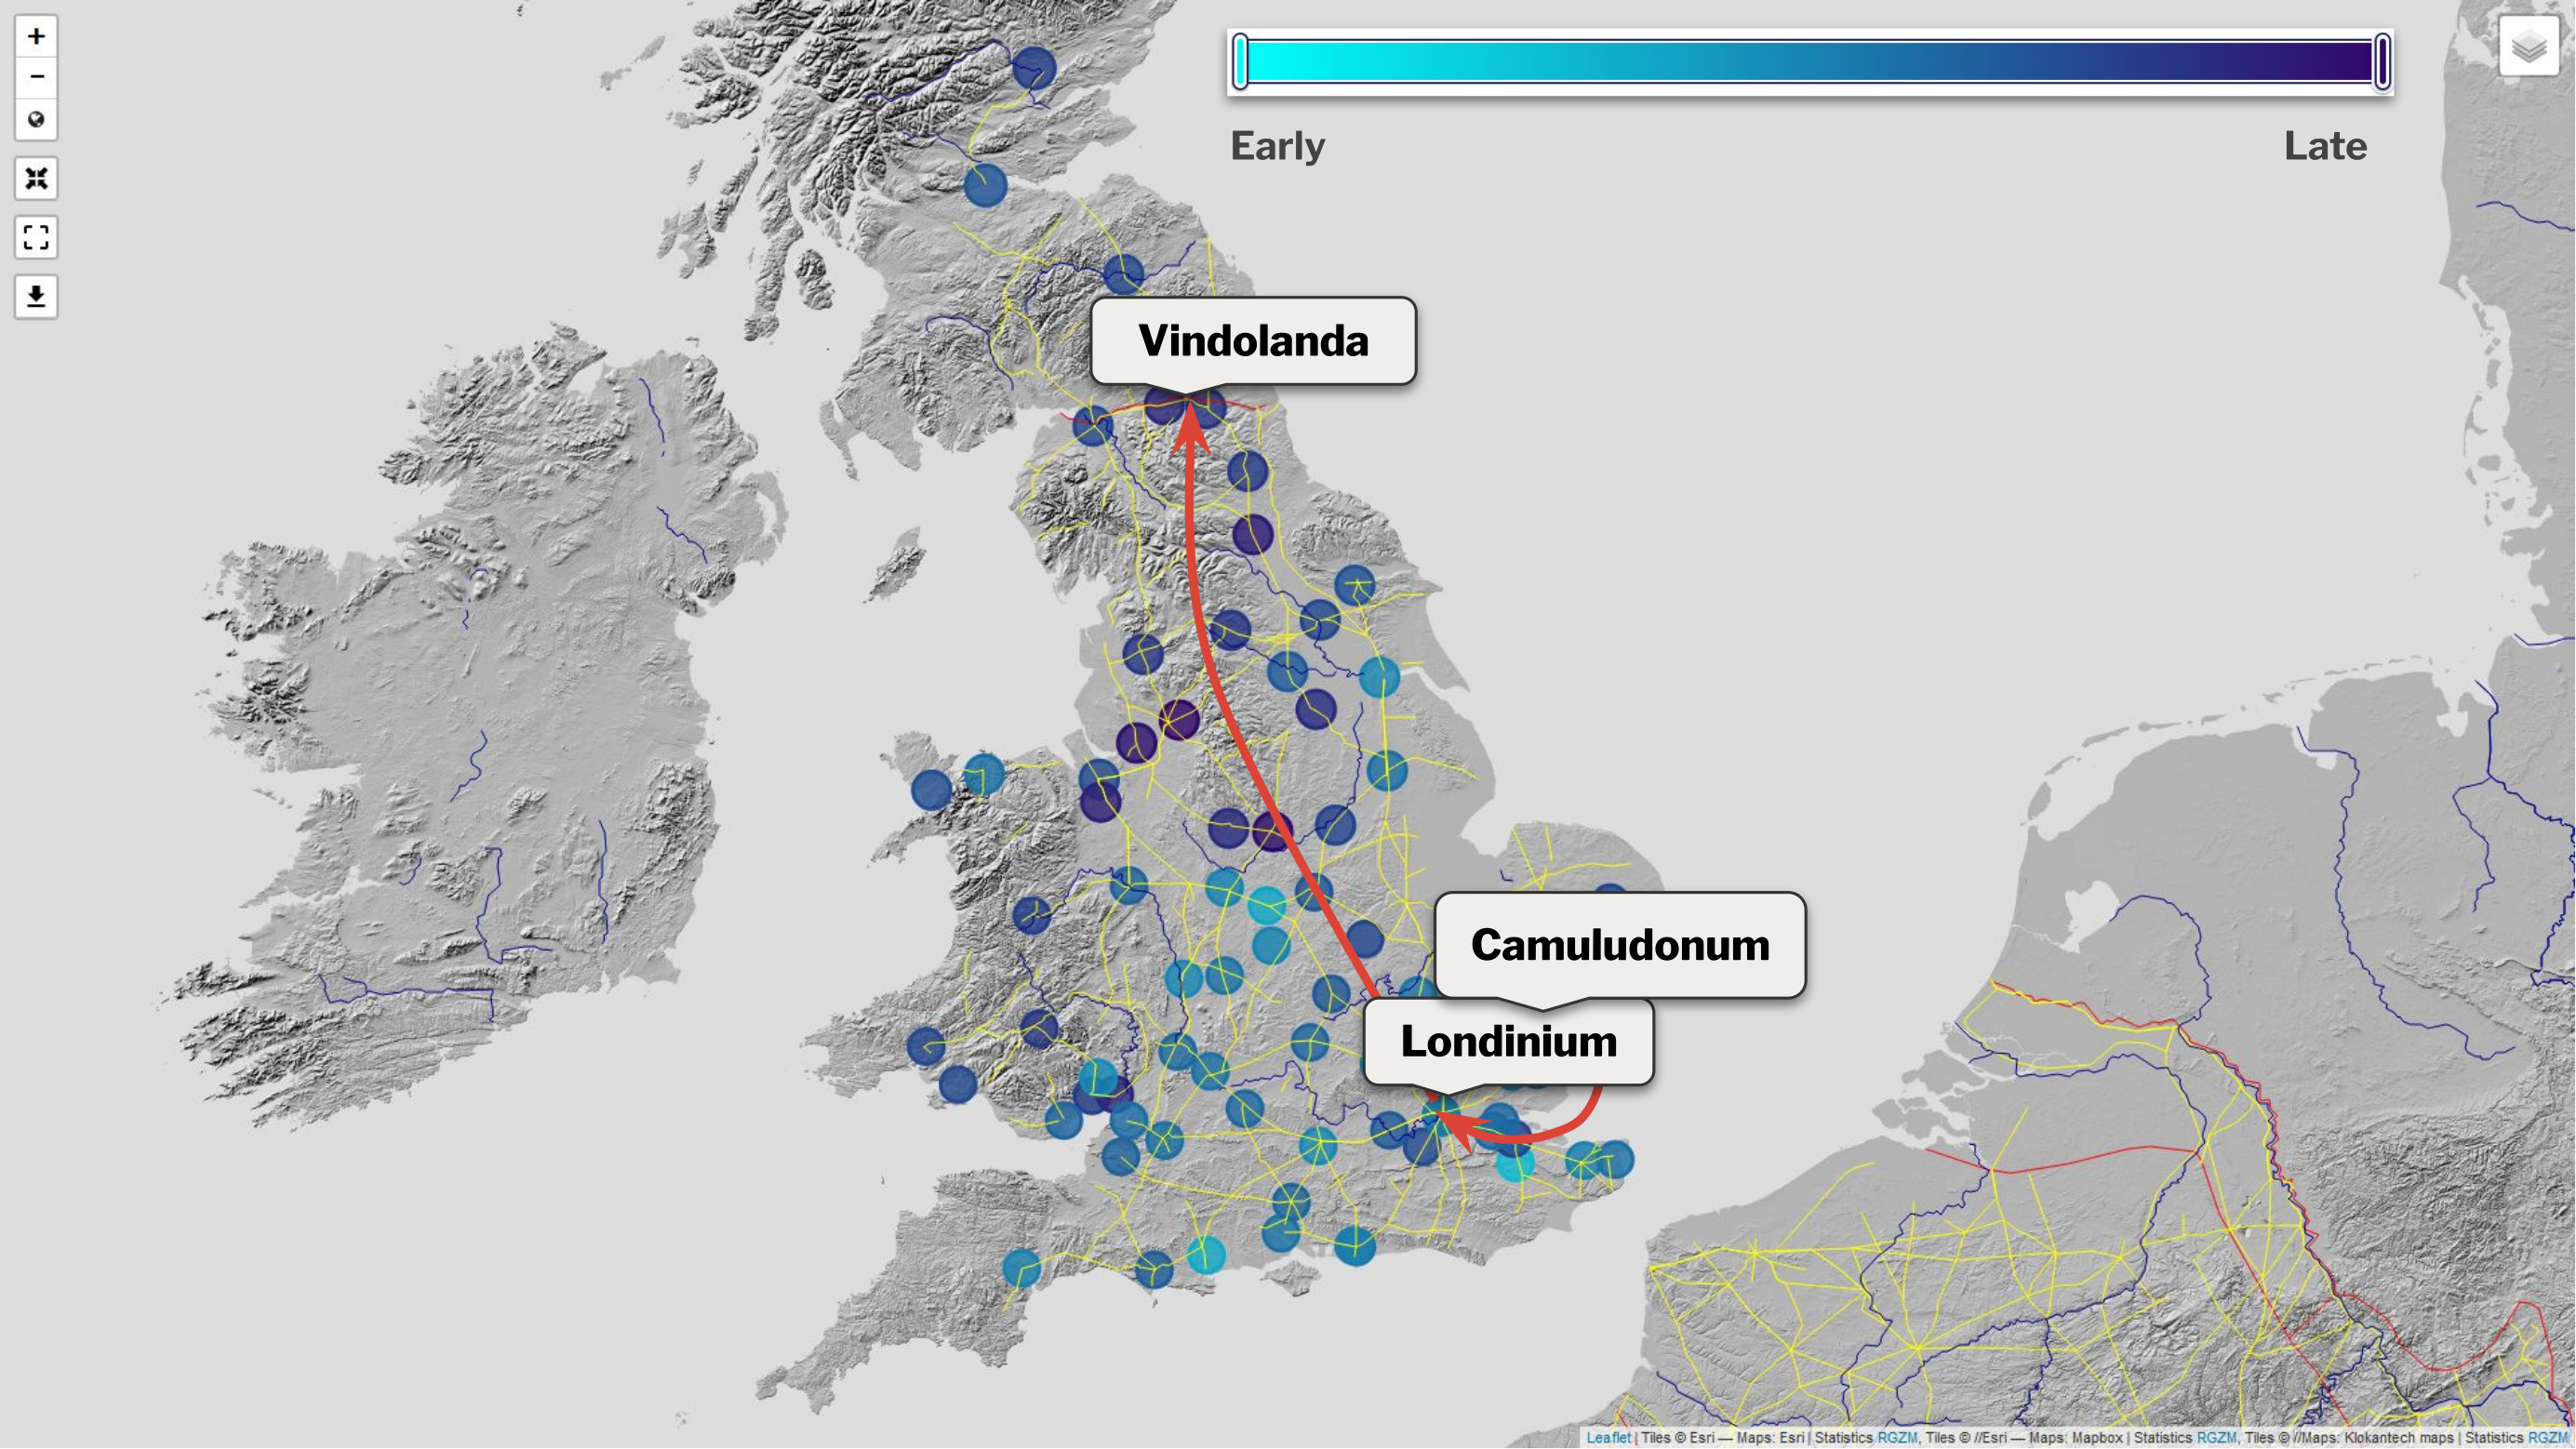
Fig. 9 Londinium and its temporal neighbors on a Map. Graphic: Florian Thiery / Allard Mees, CC BY 4.0
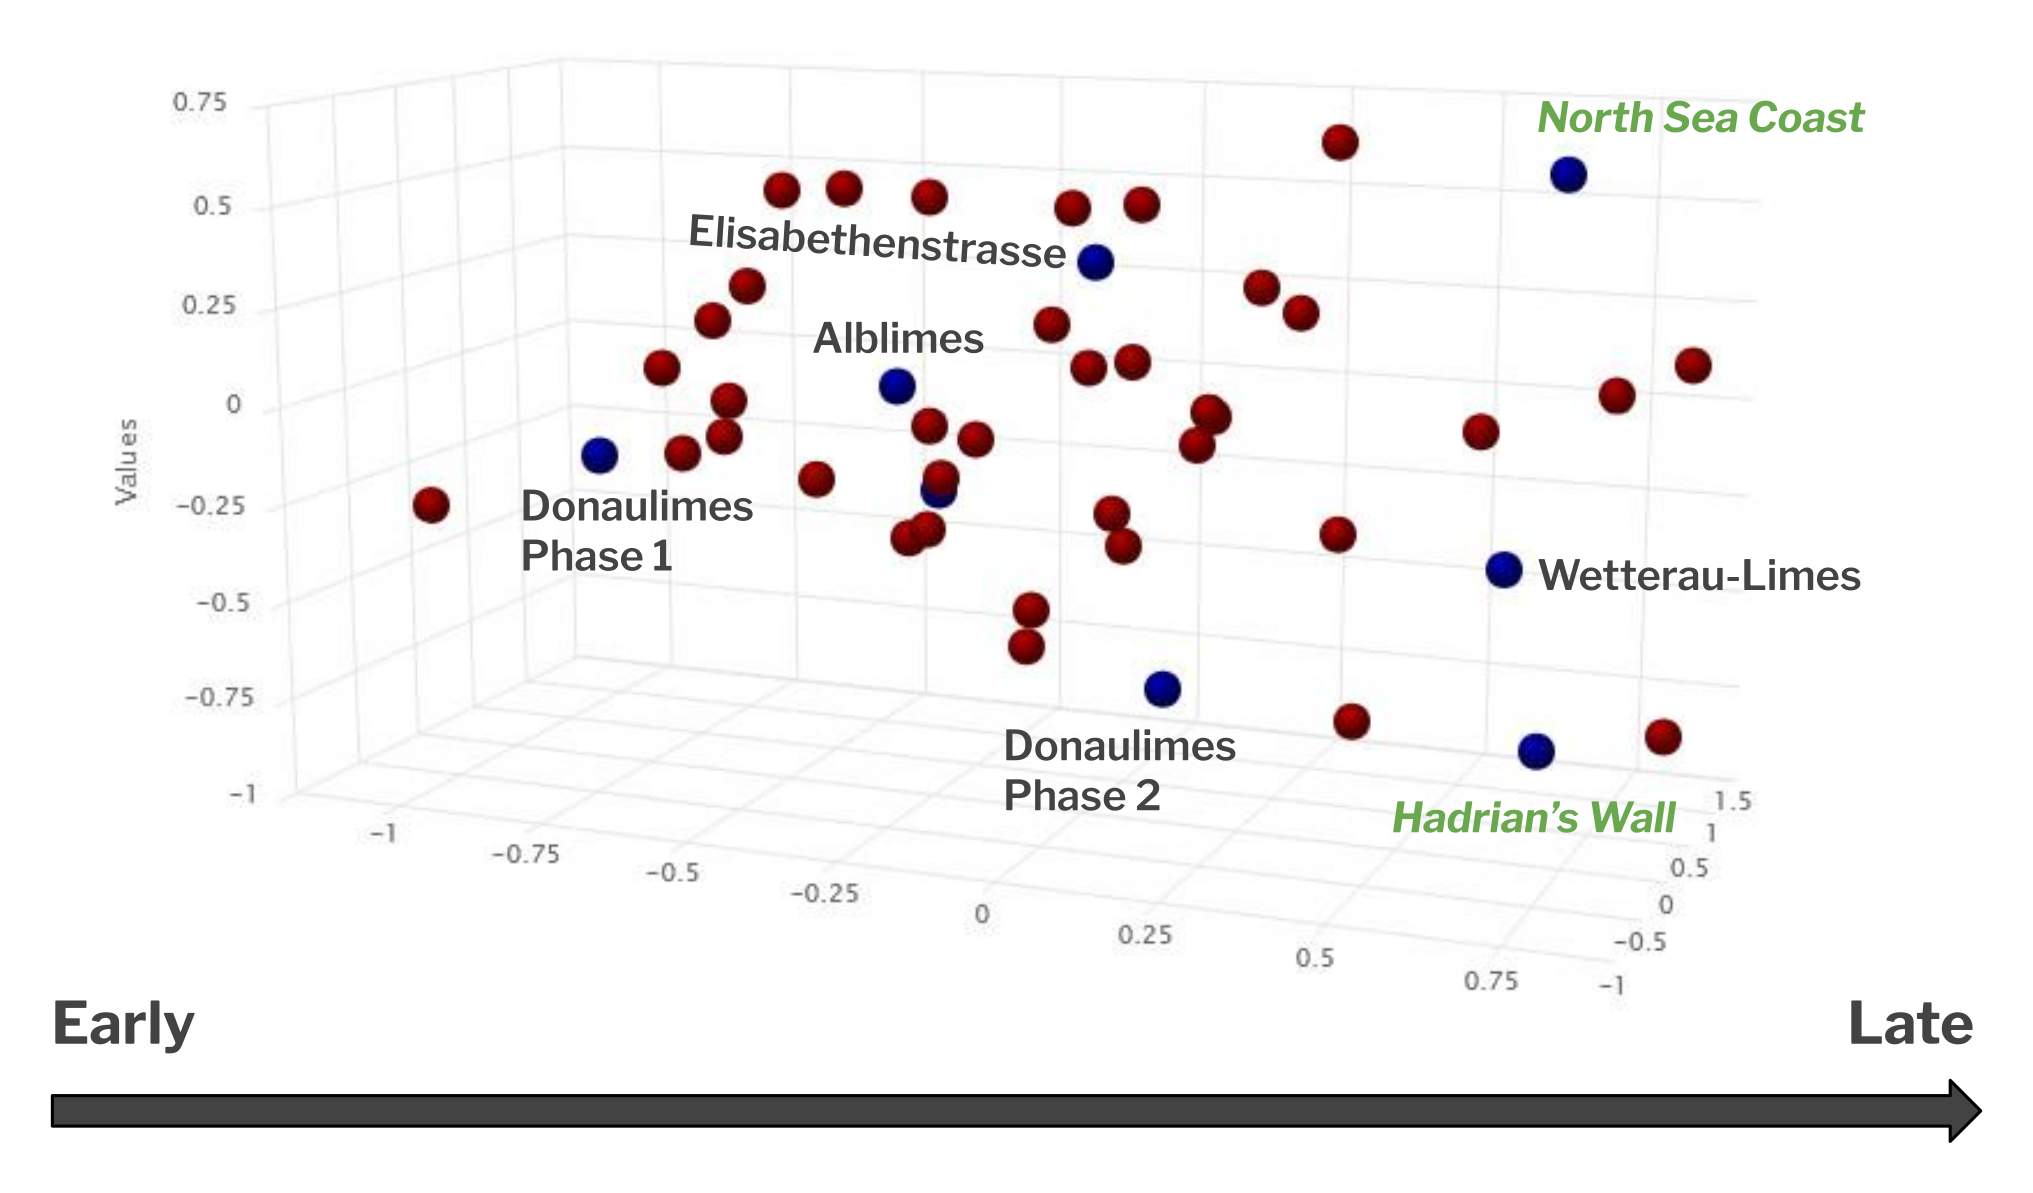
Fig. 10 CA Result. Graphic: Florian Thiery / Allard W. Mees, CC BY 4.0
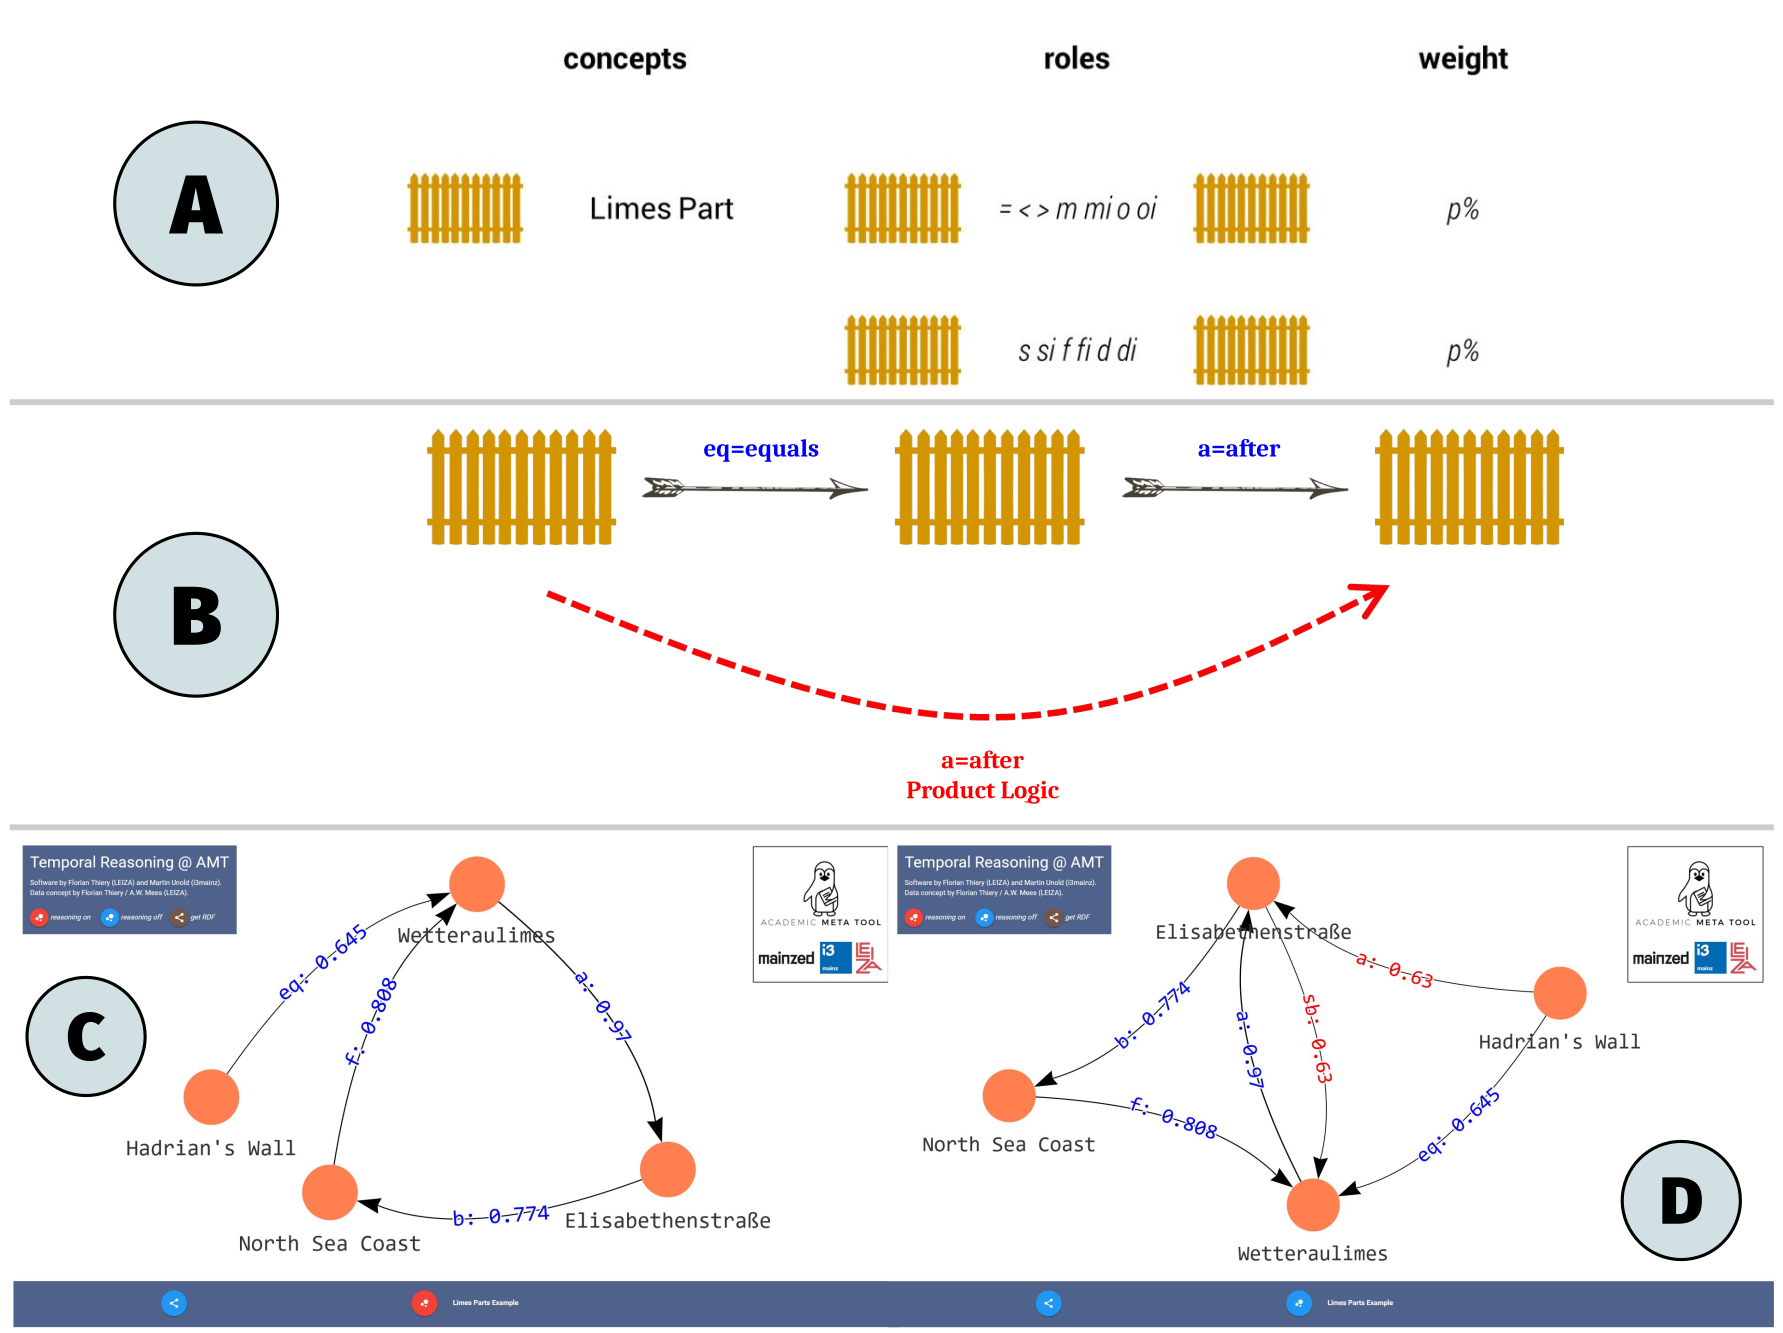
Fig. 11 A: The AMT time ontology using Allen’s interval algebra. B: AMT Axiom to perform reasoning using the during and after intervals using the product logic. C: Exemplary AMT modeling with the AMT web tool . D: Exemplary AMT reasoning with the AMT web tool. Graphic: Florian Thiery CC BY 4.0
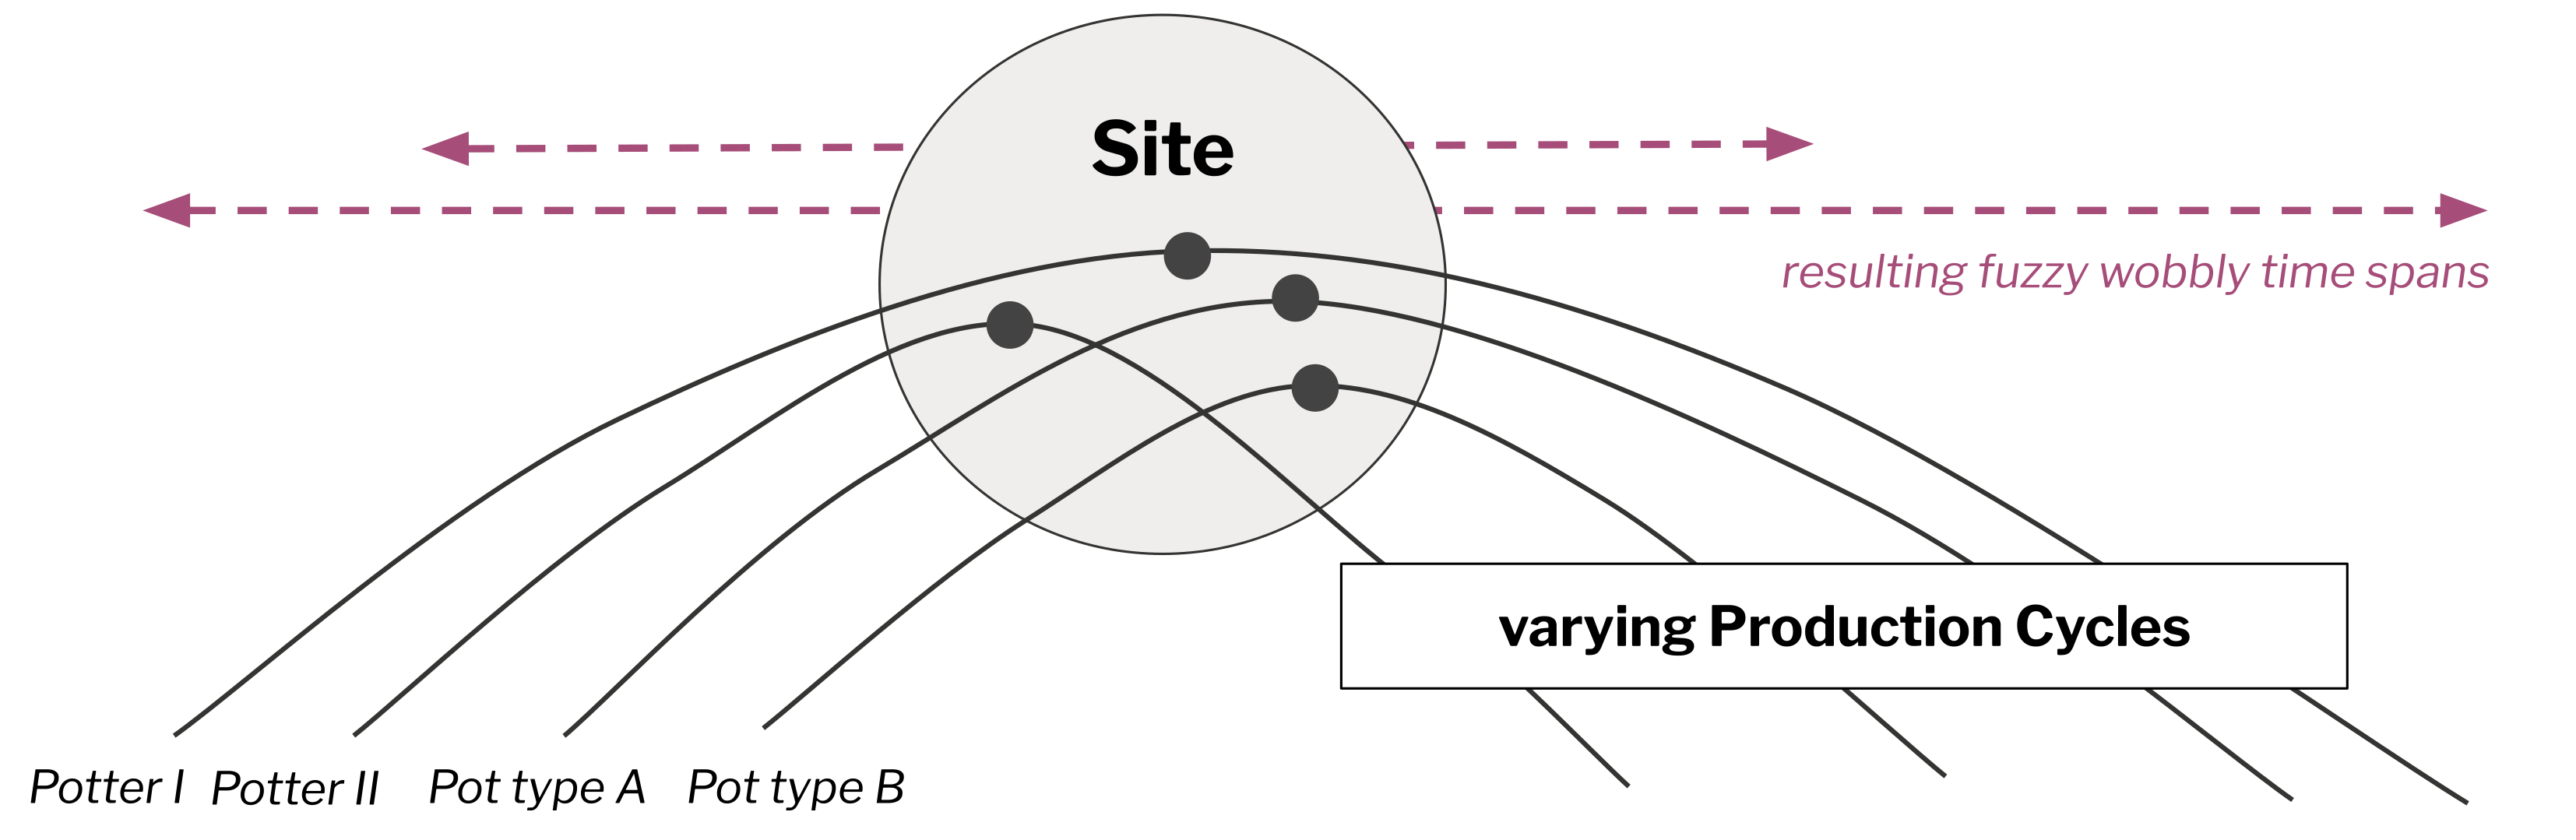
Fig. 12 Wobbling datings due to varying underlying production cycles. Graphic: Allard W. Mees CC BY 4.0